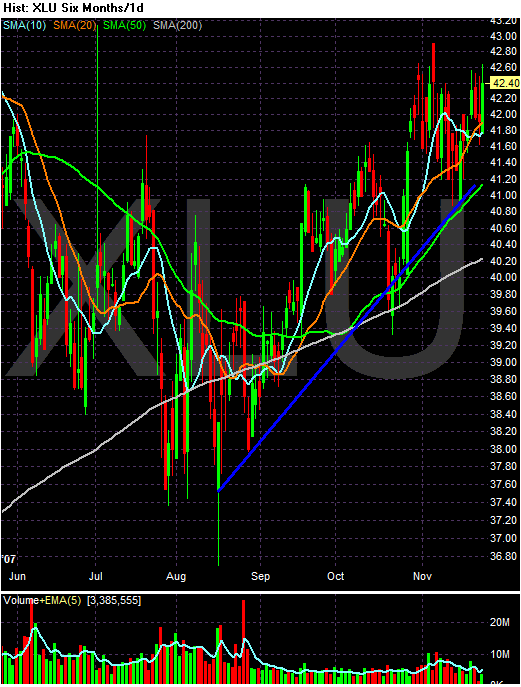
Above is a chart of the Utilities ETF. Notice the following.
1.) The index has increased from a low of 37.60 in mid-August to to the current level of 42.40. That's an increase of 12.76%.
2.) Prices are above the SMAs and the SMAs are in general aligned in a bullish manner with the shorter SMAs above the longer SMAs. However, the 10 and 20 day SMAs are jockeying for position here.
3.) There is a clear uptrend in place.
4.) The index is above the 200 day SMA.
What does this mean? The utilities are rallying. The next question is why? Because they are a safe, recession proof area of the economy. The underlying reason for this rally is probably the exact same as the Treasury market rally.