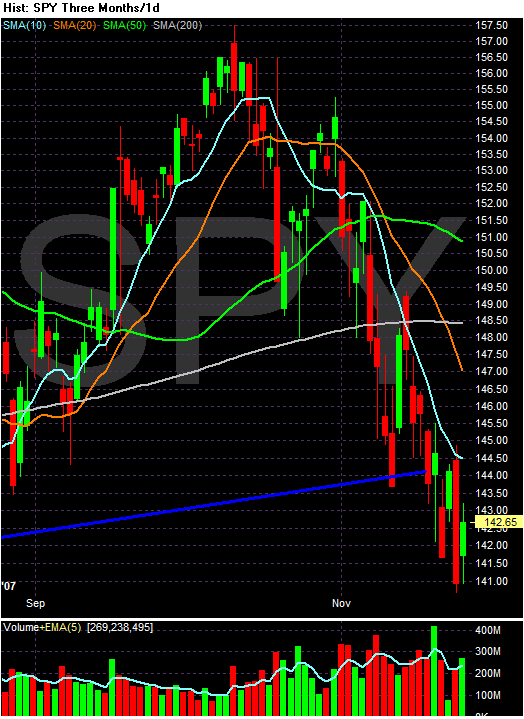
Notice the ETF has been dropping for awhile. No market moves in one direction. Also consider that short-term trading indicators like stochastics and William's percentage numbers are very oversold right now. In other words, a rebound would not be unheard of under these conditions.
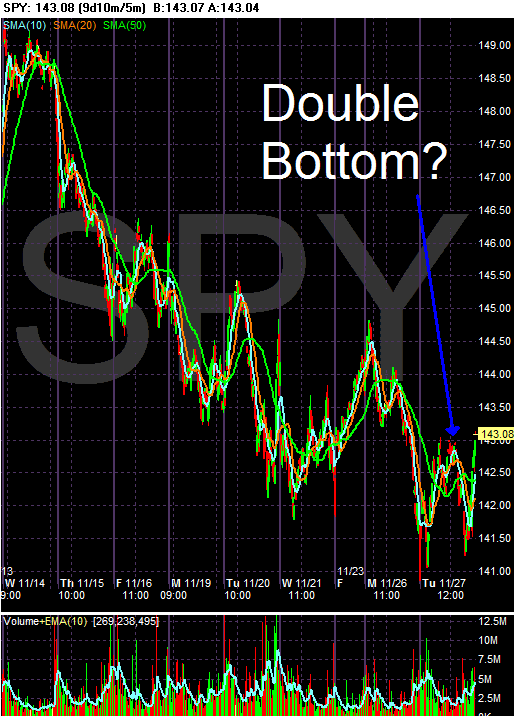
On the 5-minute chart, the index may have formed a double bottom.
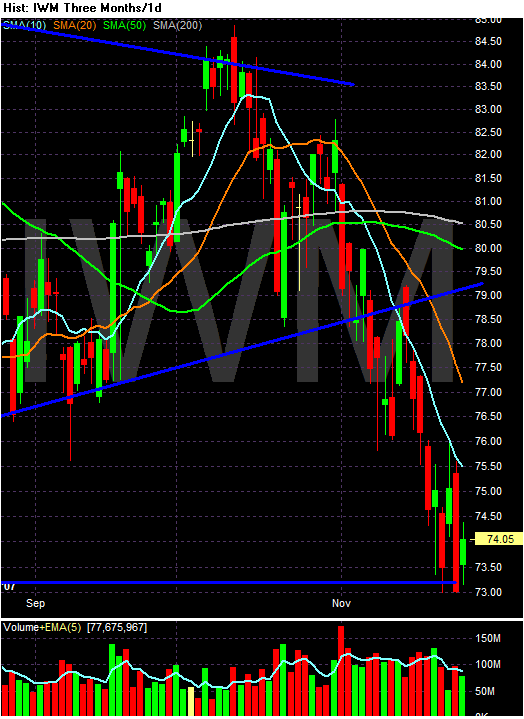
The daily IWM (Russell 2000) also shows a consistent downtrend like the SPYs.
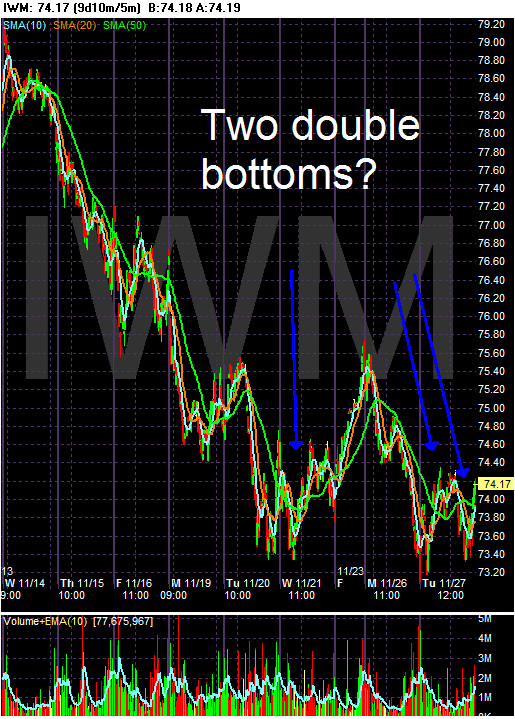
And on the 5-minute chart we have the possibility of two double bottoms. The first occurred today like the SPYs. The second would be the period of late Tuesday/Wednesday of last week and today.
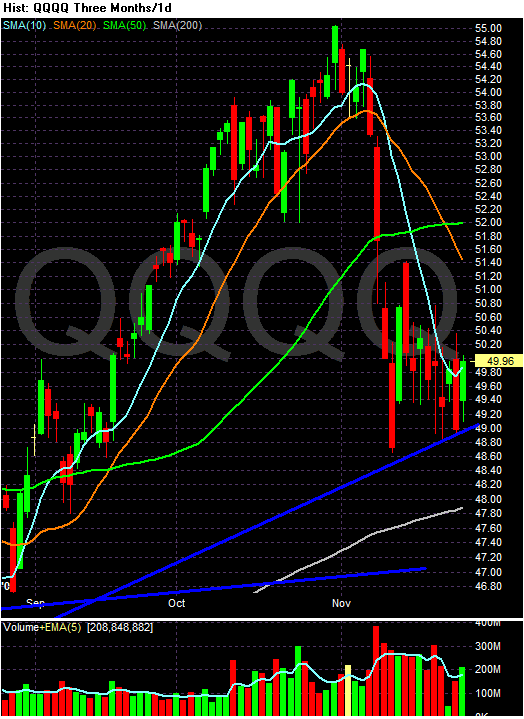
On the daily QQQQ chart we have a clear consolidation pattern. The consolidation occurred after a hard move down.
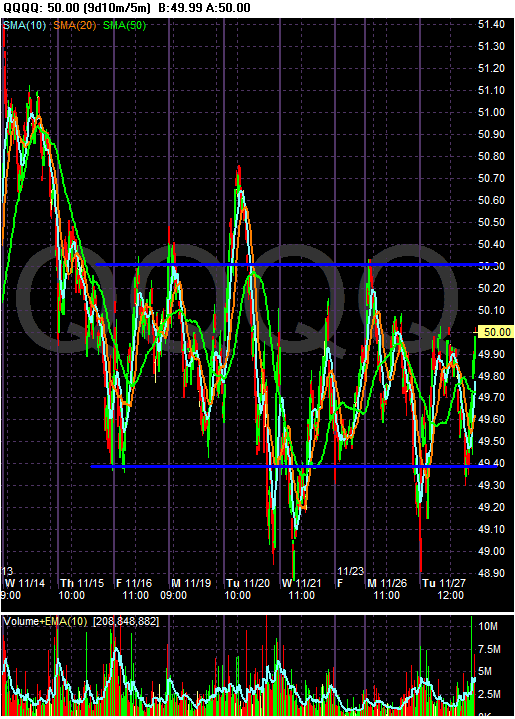
The 5-minute chart illustrates this consolidation clearly.
There is still a ton of bad news out there. Today's home price release is just one of the many problems we are seeing which is driving the market lower. But no market moves down forever. The daily charts all show some type of reversal formation, short-term technical indicators are oversold and the SPYs and IWMs have been moving down for some time. All of these factors indicates a reversal might be in the cards.
Now, I'm not saying we're going to have a rebound with 100% certainty. Chart reading is not an exact science by any stretch of the imagination. And the market will do its best to make an ass out of you at all times -- and the market has plenty of resources to do that.