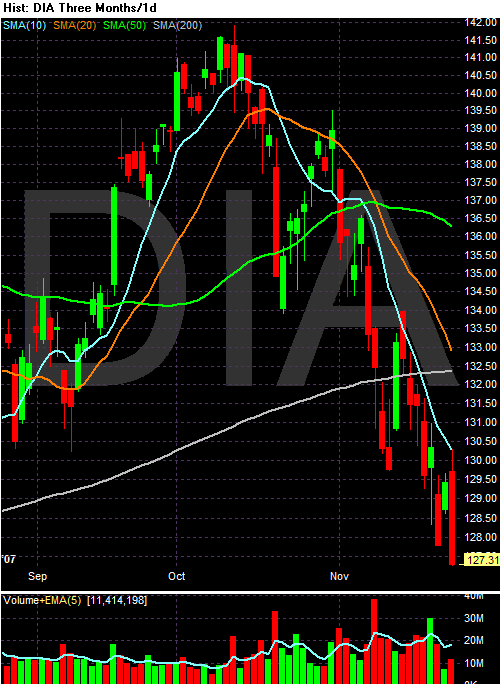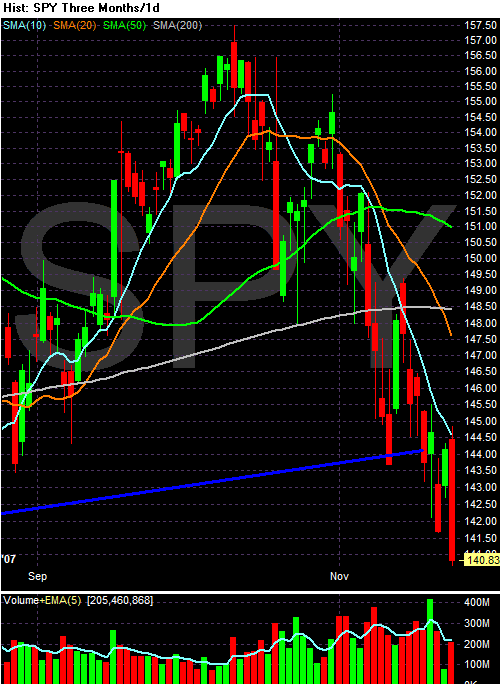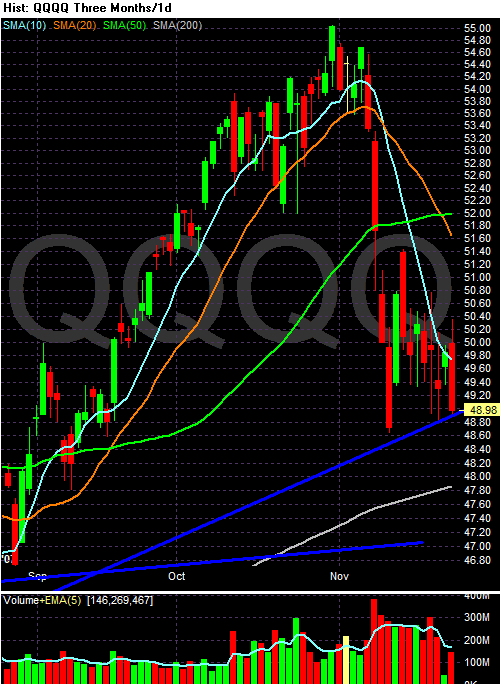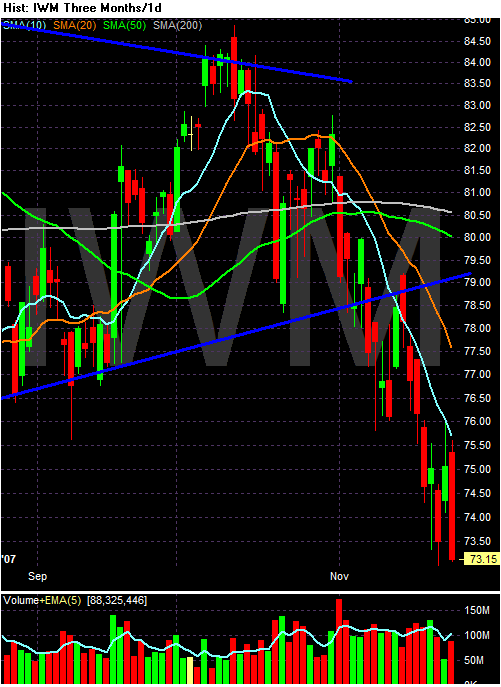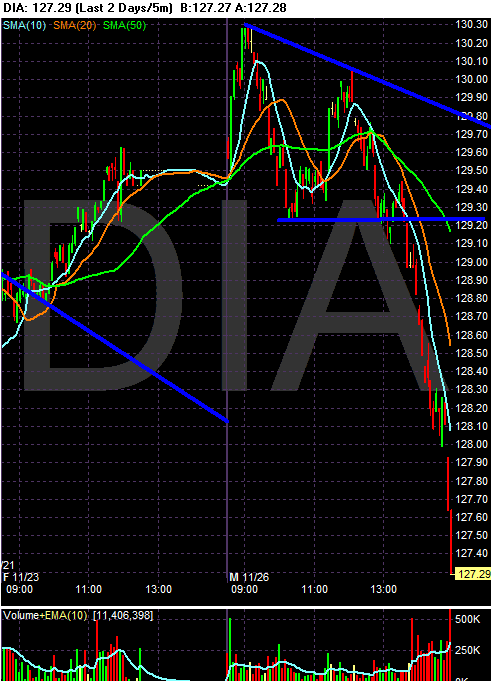
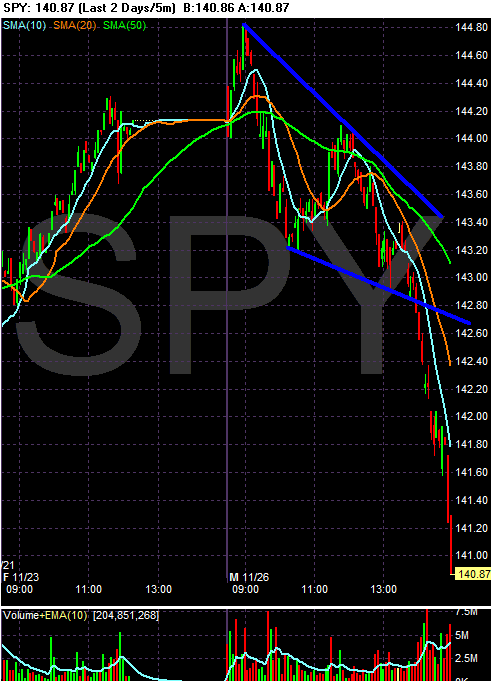
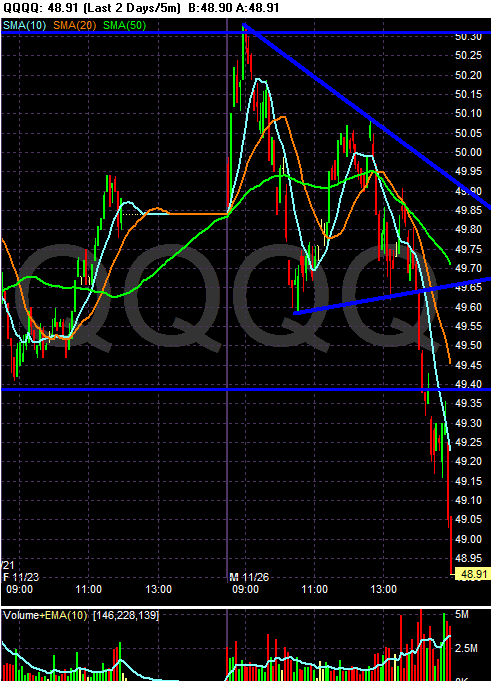
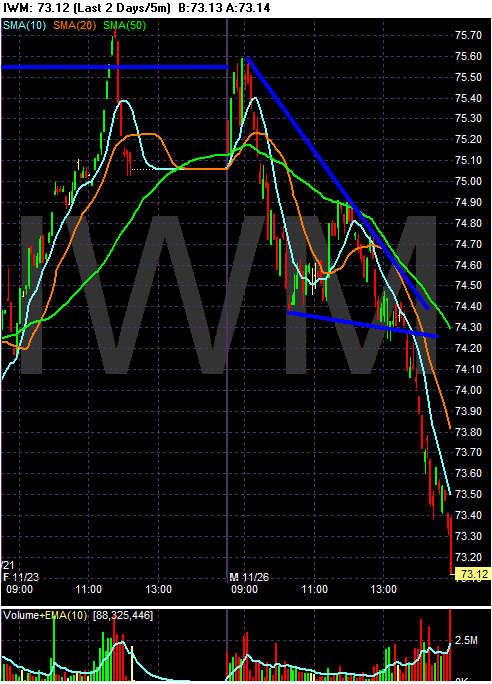
Following are the daily charts in the same order. Notice the following:
1.) All indexes printed a bearish engulfing pattern today.
A chart pattern that consists of a small white candlestick with short shadows or tails followed by a large black candlestick that eclipses or "engulfs" the small white one.
2.) All of the indexes' short-term moving averages (10 and 20 day) are heading lower.
3.) The SPYs, DIA and WIM are below the 200 day SMA.
4.) The QQQQs -- which had been consolidating until today - got a big sell-off indicating their post consolidation move is likely to be lower.
