Here are some observations from that analysis.
1.) The XLEs and XLBs -- which were a prime driver of the latest bull market -- have stopped advancing. This may be a sign that traders who rode these sectors for most of the year are getting out and taking profits.
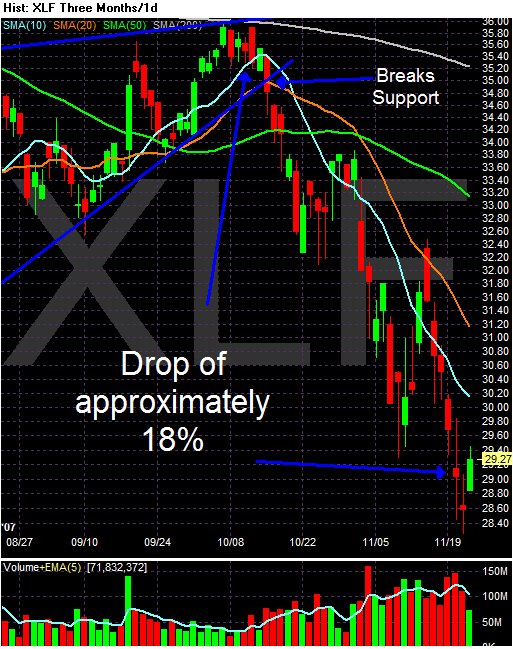
2.) The financials -- which comprise about 20% of the S&P 500 -- have a negative return for all the time periods.
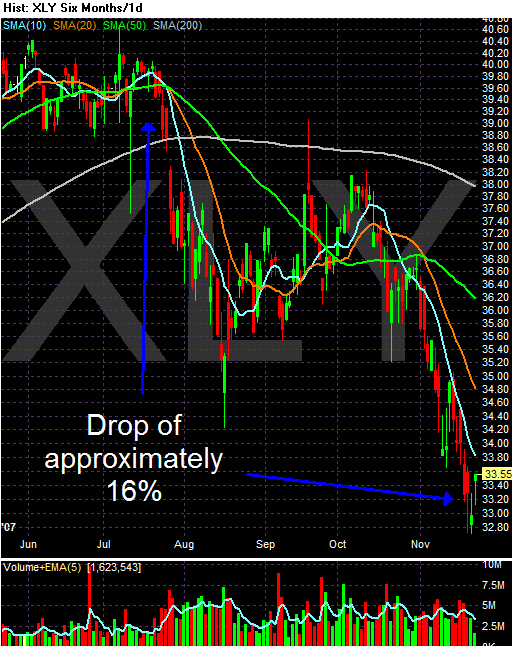
3.) Consumer discretionary has a negative return for all but one time frame (yearly).
4.) Over the last 30, 10 and weekly period, the best performing sectors are utilities (which performed best over the last 30 days) and consumer staples (which performed best over the last 10 days). Energy popped over the last 5 day period, largely thanks to oil's rally.
In short, it looks as though traders are taking profits in the previously strong areas of the market and are shifting those realized gains into safer, recession resistant areas of the market.
In addition, consider the following charts:
Consumer Discretionary

Financials

Transportation

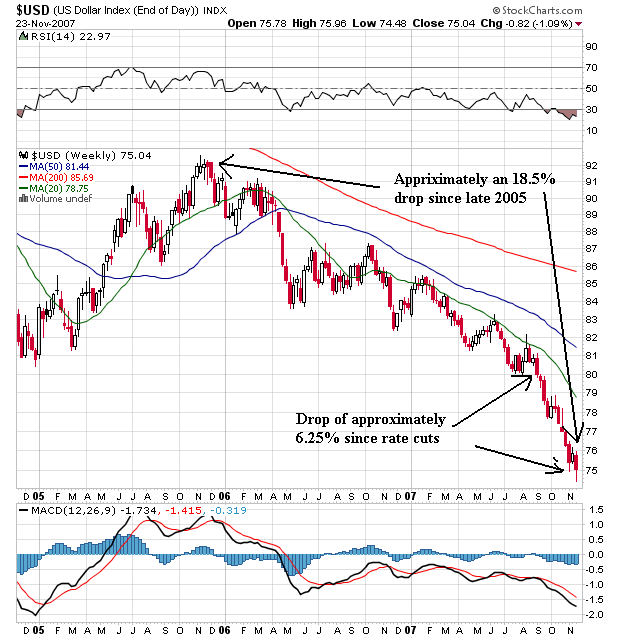
The dollar

These are not good looking charts -- unless you are looking to short the market.