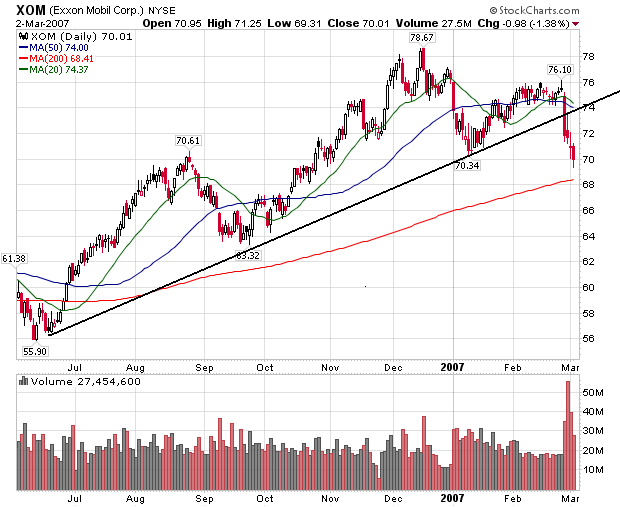
Exxon (XOM),
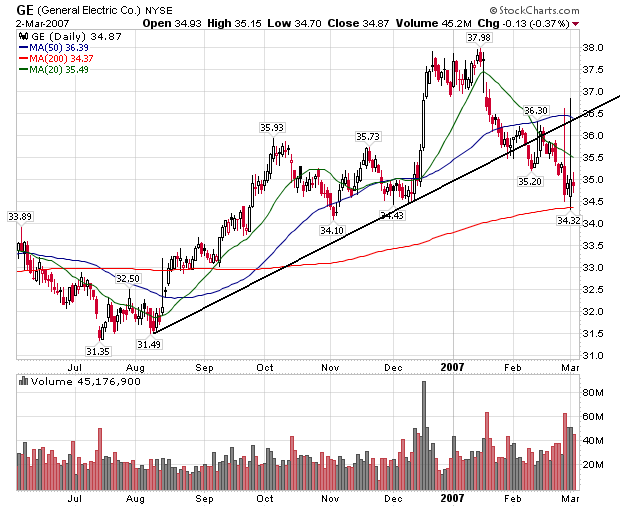
GE,
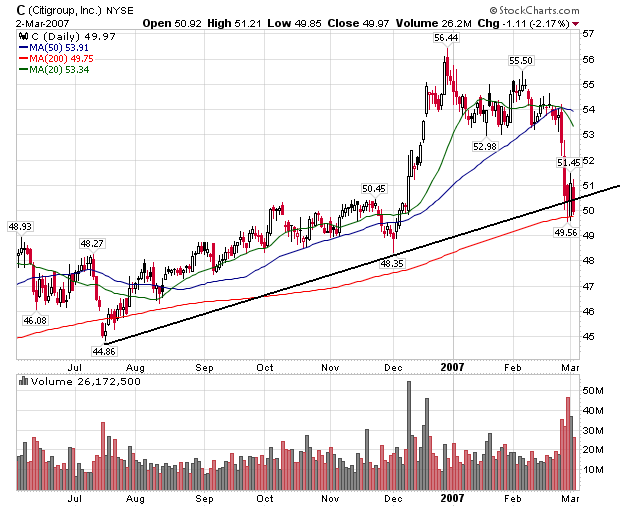
Citigroup (C),
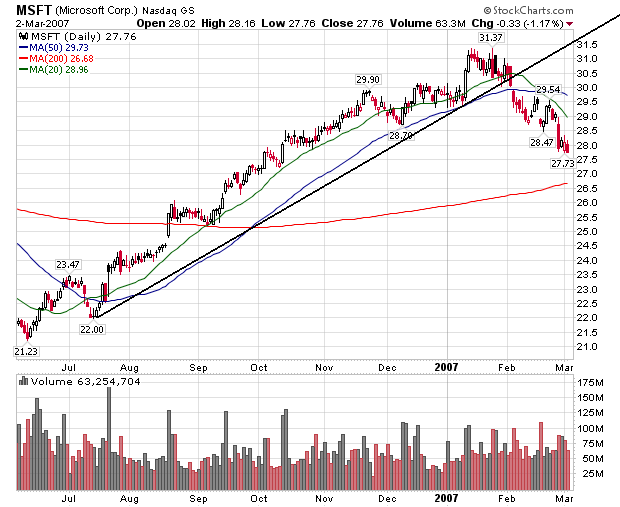
Microsoft (MSFT)
Bank of America (BAC),
These stocks are a little over 10% of the index. That means their charts are pretty important to the index. Let's see what their charts look like.
Exxon
GE
Citigroup
Microsoft
Bank of America
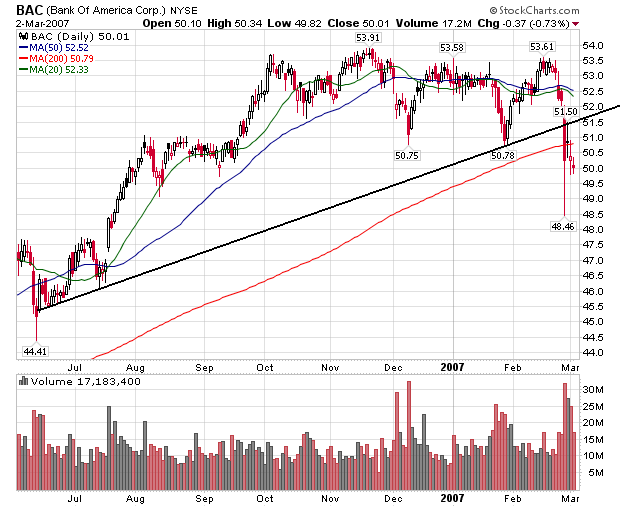
With the exception of Citigroup, the top four market cap stocks have clearly broken their upward trend.