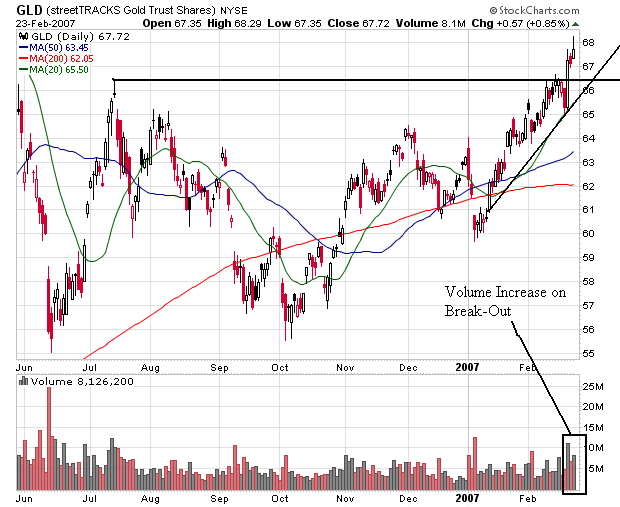
Here's a chart of the gold ETF:

Last week, the ETF broke through resistance on strong volume. In addition, an uptrend is strongly intact. Both of these moves indicate a bull run may have started.
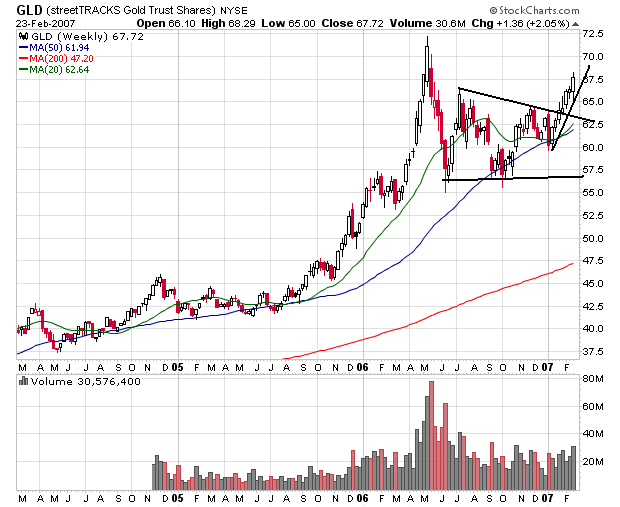
Here's the weekly chart:

Notice the chart spent about 6 months consolidating gains in a classic triangle formation. Then last week, the chart broke-out on strong weekly volume. We also have a strong uptrend intact.
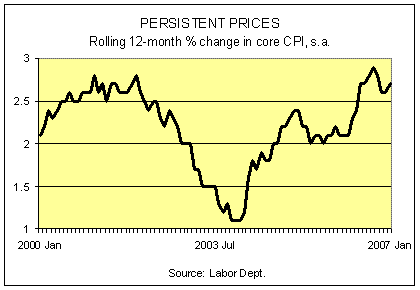
What set this off? Last week we had a bearish CPI report from the BLS. Here's a chart of the rolling change on CPI from The Capital Spectator

As the CS noted:
Core CPI is now running at a 2.7% annual pace through last month. That's up from 2.6% for 2006 and close to the peak of recent years (2.9%) set last September. The rising pace of core inflation is a problem because the Fed is widely reported to have a target of 1-2% for core. By that standard, the central bank is behind the monetary eight ball.
The Fed, in sum, has more work to do to bring core CPI down, or at least convince the market that core CPI is no longer rising. There's reason to wonder how this task will play out. As we reported on Monday, the pace of growth is rising for M2 money supply. Coincidence? For the moment, we prefer to err on the side of caution and answer "no."
So long as inflation is in that kind of uptrend, gold has a strong wind at its back.