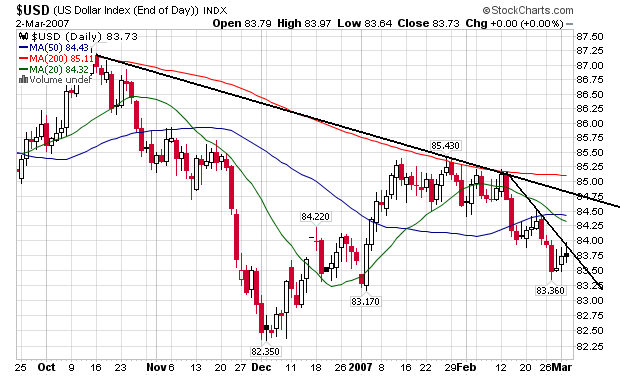
We're still firmly in a short-term down trend. The 20 day SMA is now below the 50-day SMA, adding another bearish point to the chart. Next week we'll be looking to see if the dollar moves about the short-term trend line or rebounds lower.
Here's the weekly chart:
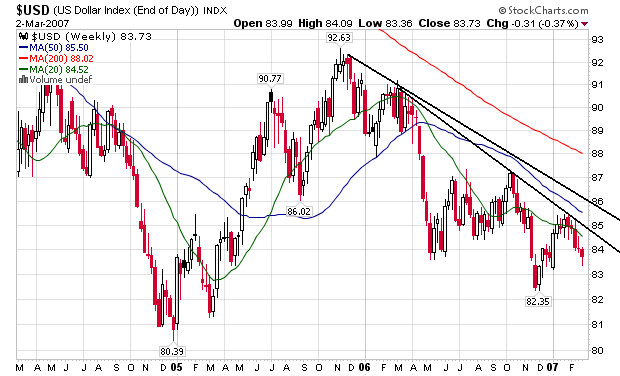
Two clear downward sloping trendlines and all three moving averages heading lower. This is a good example of a bear market chart.