Here's a chart from Stockcharts:
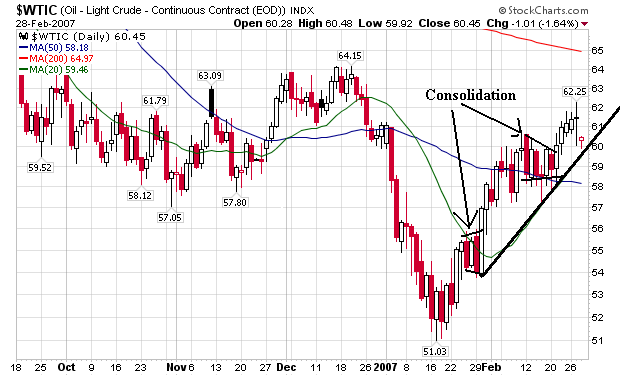
Since the price low in mid-January, oil has been steadily moving up. It consolidated gains twice -- once in late January and once in mid-February. While it's still in an uptrend, today's drop to near the trend line (which is masking the 20-day simple moving average) indicates possible weakness. This means the next few trading days are pretty important to this particular uptrend -- at least from a technical view.
Remember oil's fundamental underpinnings have tons of risk and volatility. Any change their will greatly impact the chart.