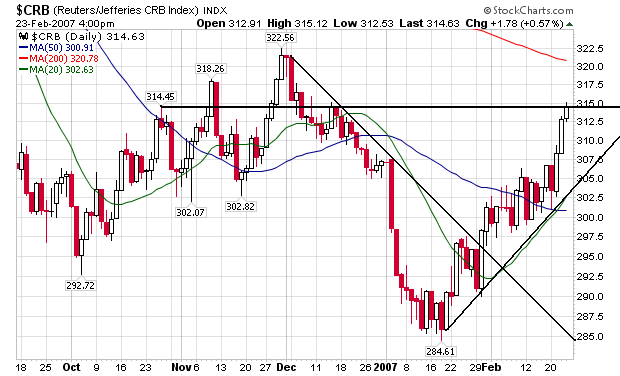
Notice the chart has broken through the downtrend started in early December. In addition, we have a nice strong uptrend that has broken through the moving averages. Finally, the 20 Day SMA has crossed the 50 day SMA -- another bullish sign.
Here's the weekly chart:
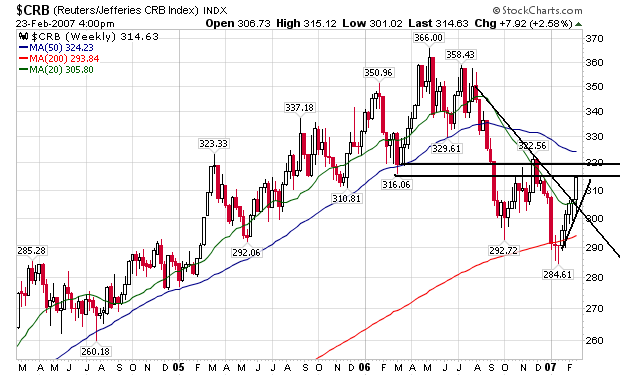
On the weekly chart we've also broken through the downward sloping trend line, crossed a moving average and are in a strong uptrend. While we are far off our highs of last year, the trend appears to be heading up.