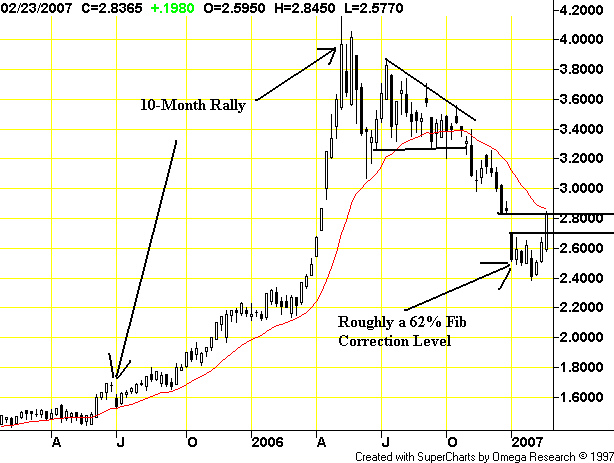
Here's a chart for copper:

This is the weakest of the three charts, largely because of large sell-off and gapping down formation. The gap down could be a selling-exhaustion gap, indicating the last of the sellers finally got out of the metal at the beginning of the year. Using Gann style accumulation analysis, this means the only buyers will be longer term investors who are looking at making a long-term play. If that is the case, than copper has formed a base here and is looking to rally.
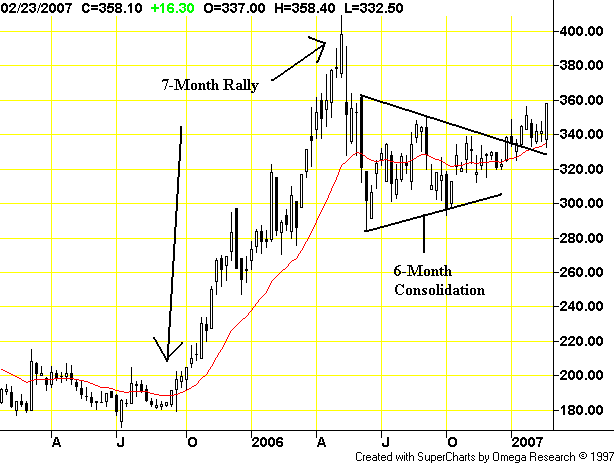
Here's a chart for Palladium:

We saw consolidation in the latter part of last year in a classic triangle trading pattern. This period essentially shook-out the positions from the previous rally and allowed other longer-term players to accumulate longer-term positions. Either way, the 6-month consolidation helped to establish a base for a summer rally.
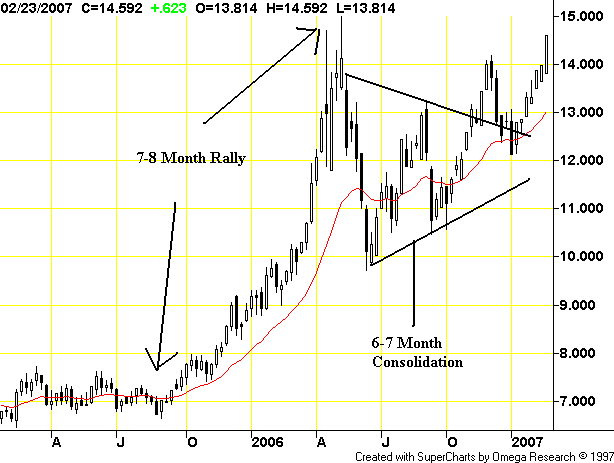
Here's the chart for Silver:

This chart's analysis mirrors that for Palladium, although the triangle consolidation is a bit wider.
All of these charts are possibly signaling an upward move. Remember we still have China and India on-line for very strong growth rates, increasing demand for base metals.