Wednesday, March 14, 2007

Oil Market Update

From AFX News:

The US Energy Information Administration said crude oil stocks rose by 1.2 mln barrels in the week ending March 9 to a total of 325.3 mln barrels. The latest figure was in line with analysts' expectations of an increase of 1.3 mln barrels, according to an AFX poll.


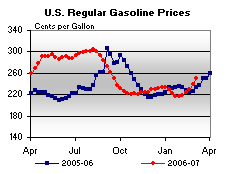
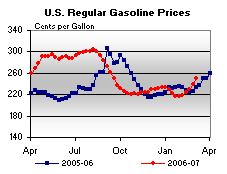
However, gas prices are still increasing, as shown by this chart from the latest DOE report:

Photo Sharing and Video Hosting at Photobucket

Here's what the DOE said in their latest report:

Gasoline prices rose sharply again, increasing 12.2 cents to 250.5 cents per gallon for the week of March 5, 2007. Prices are now 17.4 cents per gallon higher than at this time last year. All regions reported price increases. The East Coast had the largest increase, with prices up 15.4 cents to 249.1 cents per gallon. Midwest prices rose 9.5 cents to 246.5 cents per gallon. Prices for the Gulf Coast were up 13.3 cents to 236.7 cents per gallon. Rocky Mountain prices increased 10.4 cents to 235.3 cents per gallon, while prices for the West Coast were up 10.1 cents to 276.5 cents per gallon. California prices were also up 10.1 cents, to 289.7 cents per gallon, 41.7 cents per gallon above last year’s price.


Note two things. First, they said prices have increased sharply again. Those are two words you don't like to see in front of gas prices. Secondly, prices are higher than they were at this time last year when gas hit $3/gallon and above in some regions.

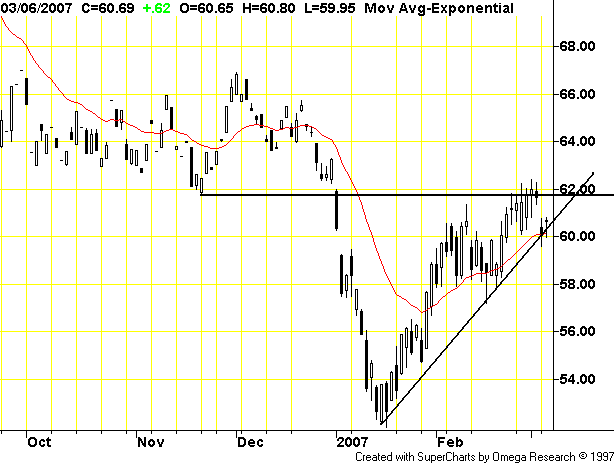
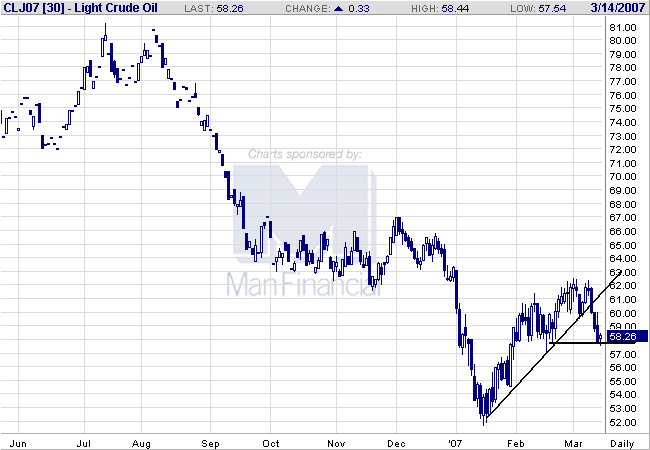
Here's a chart of oil:

Photo Sharing and Video Hosting at Photobucket

Oil has sold-off and broken its rally that started in mid-January. So far, it appears to be bottoming at roughly $58/bbl.

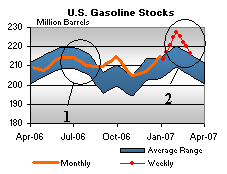
Let's sum up so far. Crude oil prices are lower now than this time last year (when they were about $66-$70/bbl). However, gasoline prices are higher now than they were last year. What's odd is now we have a higher stockpile of gasoline than we did last year. Here's the chart of gasoline inventories, with last summer marked 1 and the current level marked 2:

Photo Sharing and Video Hosting at Photobucket

We have more supply now (although it is dropping), but prices are higher. Gas prices may be moving up in response to the drop in inventories and the speed of the drop.

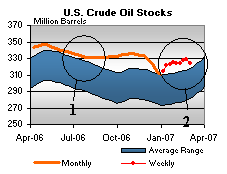
Maybe the issue is the overall oil inventory, which has dropped since the summer peak:

Photo Sharing and Video Hosting at Photobucket

Why all of this talk about oil? In his latest Congressional testimony, Bernanke said inflation was down largely as the result of decreasing energy prices. Therefore, as energy prices increase we can probably expect an uptick in inflation. This will hem the Fed in and prevent them from lowering interest rates if there is a continued economic slowdown.

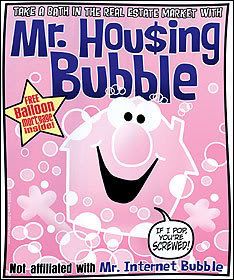
Great Cartoon

Photo Sharing and Video Hosting at Photobucket

Special thanks to London Yank for this.

Asian Markets Tank

From the WSJ:

Asian-Pacific markets fell sharply Wednesday in the wake of a sharp sell-off on Wall Street, with Japan's benchmark index falling 2.92% with exporters retreating as the yen strengthened against major currencies.


I guess we're returning the favor from a few weeks ago.....

More on Yesterday's Retail Sales

From the WSJ:

In an email to clients, Haseeb Ahmed, U.S. economist with J.P. Morgan Chase & Co., noted that core retail sales -- a measure that excludes cars, gasoline and building supplies -- were down 0.2% in February, the weakest showing since March 2005. Core retail sales for January and December were weaker than originally reported: January was revised to 0.3% growth from a previously reported 0.4% growth; December was revised to 0.9% growth from 1%.

....

The retail-sales report also showed that spending at electronics-and-appliance stores fell 0.3%, the second straight month of decline, while sporting-goods and hobby stores were down 0.8%. Restaurants and bars were down 1.2%. Some economists say such data show consumers are getting more cautious. "The housing market is clearly weighing on consumers. I think they're looking at debt burdens that are very high and saying we need to pull in the reins a little bit," says Richard Moody, chief economist at Mission Residential, a real-estate investment firm in Austin, Texas.

Separately, the Commerce Department reported that seasonally adjusted business inventories were up 0.2% in January, compared with being flat in December. The retail-sales report, combined with the news about business inventories, prompted some economists to downgrade their forecasts of first-quarter gross domestic product, the broadest measure of economic output. Credit Suisse Group lowered its first-quarter GDP estimate to 2.0% from an earlier estimate of 2.5%. Macroeconomic Advisers LLC reduced its first-quarter GDP forecast to 1.7% from 2.1%.


A few points.

1.) Retail sales were revised lower for the last few months. That means economists assumptions about consumer behavior are going to have to come down for their future projections, which will lower GDP growth estimates.

2.) Note that spending dropped across the board -- hobby stores, restaurants and sporting goods stores. Some of this may be a post-holiday slowdown. But with all of the bad housing news coming out, it's reasonable to assume consumers may be pulling in their spending habits.

3.) Personally, I've become less concerned about inventory numbers, largely because retailers (and anyone else who would traditionally keep inventory) have become incredibly adept at inventory management. The inventory to sales ratio at the national level has continued to drop while consumer spending has continued to rise. This tells me that inventory systems are pretty advanced.

Tuesday, March 13, 2007

Country Wide CEO: "Mortgages Are in a Liquidity Crisis"

From Reuters:

Countrywide Financial Corp. (CFC.N: Quote, Profile, Research) Chief Executive Angelo Mozilo said on Tuesday the U.S. mortgage sector is entering a "liquidity crisis," but that investors and speculators are overreacting by punishing healthier lenders as well as marginal ones.

"This is now becoming a liquidity crisis," and "it's going to get uglier," Mozilo said on CNBC television.

Mozilo said the winnowing out will be "great" for Countrywide, the largest U.S. mortgage lender, which might pick up market share.

He said investors and speculators, who have punished shares of many companies with mortgage exposure, have engaged in an "overreaction, a baby out with the bathwater." Still, he said the housing slowdown means "the economy will be impacted negatively, and the (Federal Reserve) will move interest rates down."


Today we've had the second largest subprime lender delisted, another entering a period of problems and the largest subprime lender say mortgages are in a liquidity crisis.

I think all of this qualifies as a bad news day.

Today's Sell-Off In Perspective

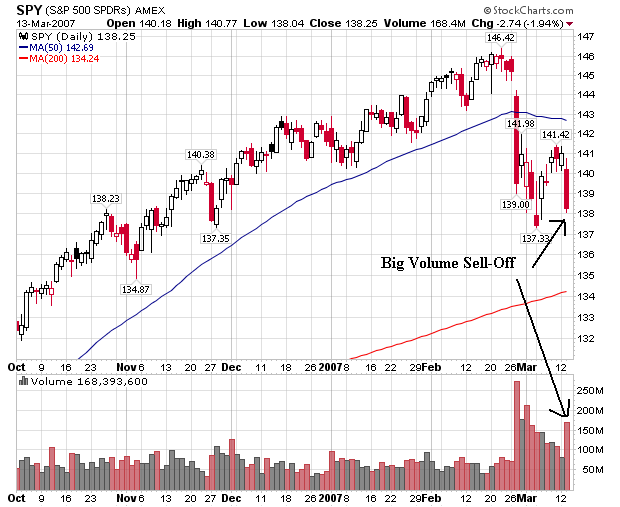
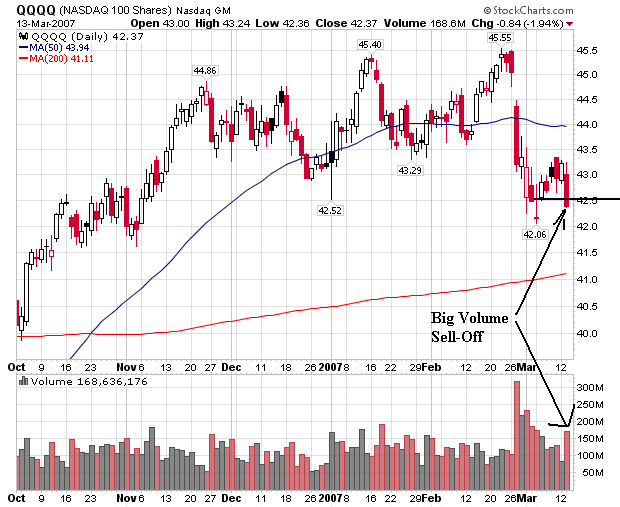
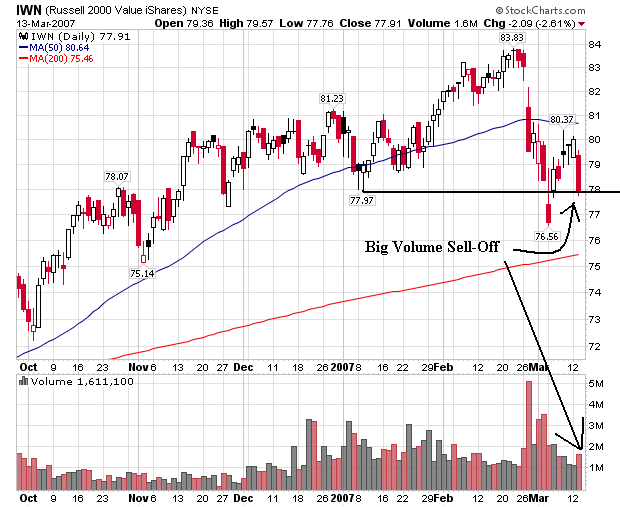
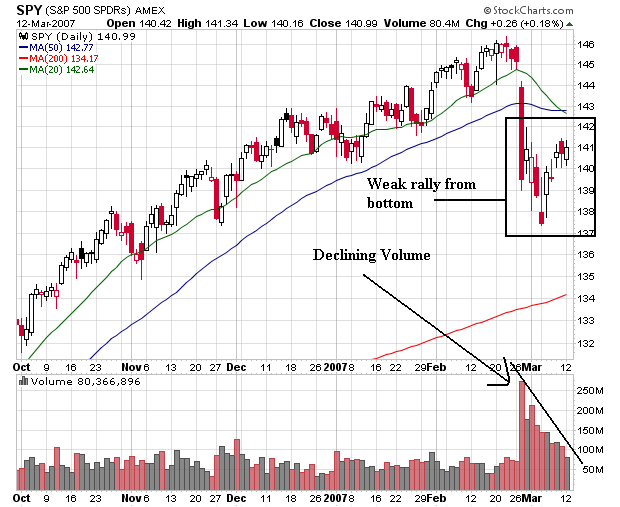
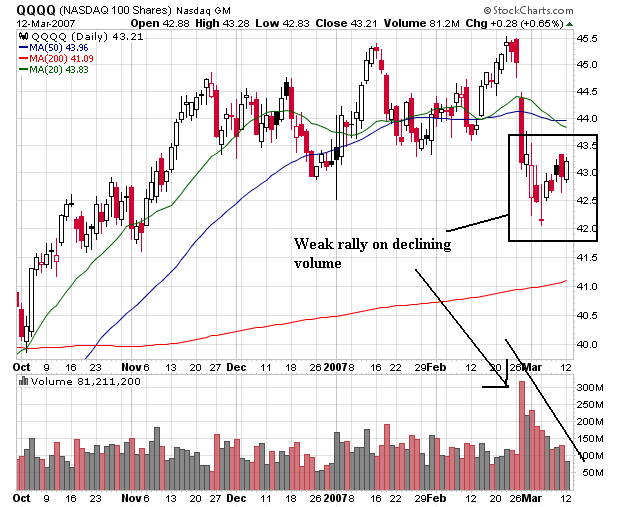
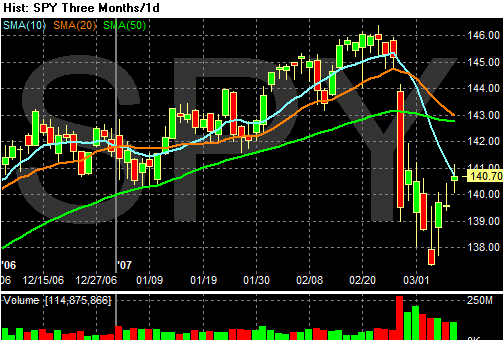
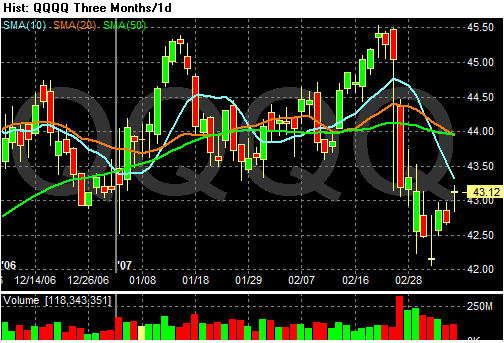
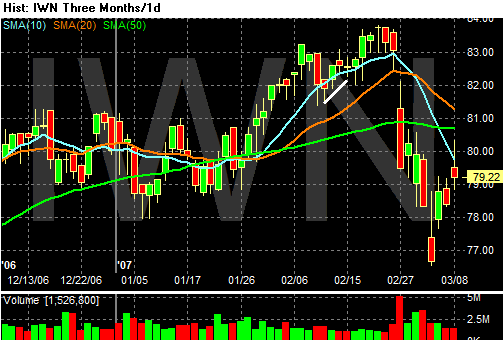
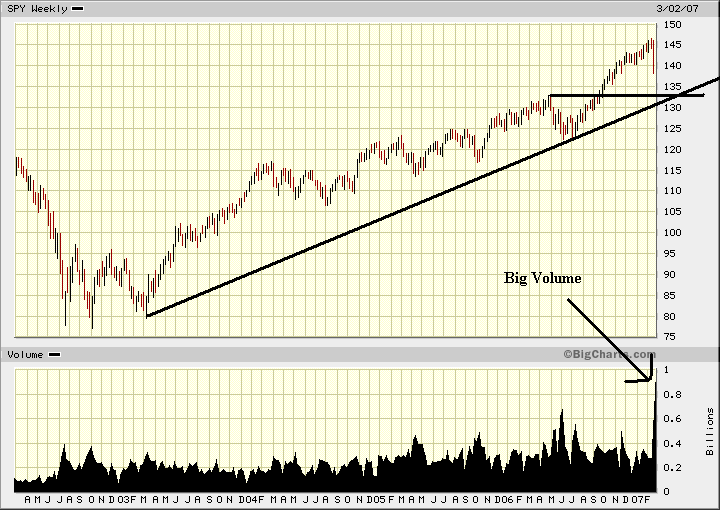
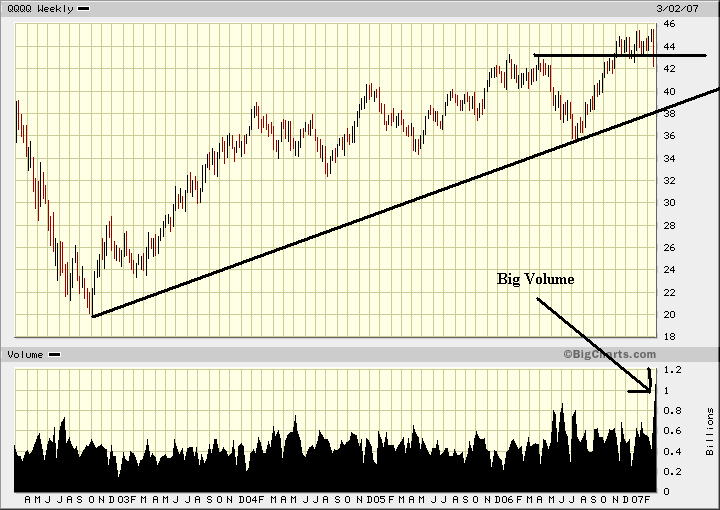
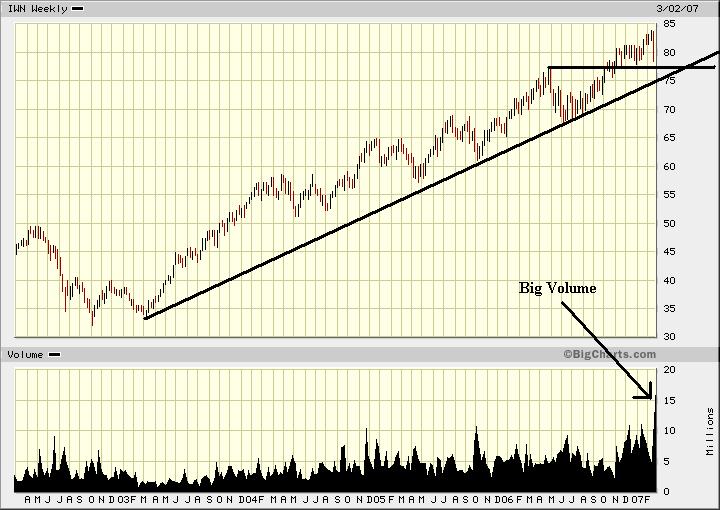
Let's go to the daily chart to see what today did to the long-term charts. Here's the SPY, QQQ and IWN to see what happened

Photo Sharing and Video Hosting at Photobucket

Photo Sharing and Video Hosting at Photobucket

Photo Sharing and Video Hosting at Photobucket

Several days ago I wrote the recent rally after the sell-off was suspect because of declining volume, but the declining volume may itself be suspect because it was coming down from a really high level. Well -- now we have confirmation. The rally was suspect.

You'll notice the same wording on each chart: big volume sell-off. Simply put, there were a ton of sellers in the market today, and they were looking to get out. They were willing to take a lower price to get out. That's one of the prime reasons for the drop.

Notice that technically, all the averages have a touch of breathing room -- but not much. Another bad day like today and the markets will be looking at a technical break-out on the downside.

Another Subprime Lender In Trouble

From the Street.com

Accredited Home Lenders (LEND - Cramer's Take - Stockpickr - Rating) is facing a liquidity crisis that analysts say could leave it following in the footsteps of New Century (NEW - Cramer's Take - Stockpickr - Rating).

Accredited, a San Diego-based mortgage company, said early Tuesday it is exploring various strategic options, including raising additional capital, as much of its cash has been used up by margin calls and forced loan repurchases. Shares plunged 62%, dropping $7.06 to $4.34.

Accredited said it has met $190 million in margin calls this year, most of them in the last month. The company said it is seeking waivers on its credit lines and cutting costs through moves including layoffs.

"We believe that the downturn in the subprime market, and the likelihood that it will persist, sharply raises the liquidity risk," said Keefe Brutette & Woods analyst Bose George in a research note Tuesday morning.


Just what the market needed -- another subprime lender with problems. Let the heads roll - again.

Ugly Day In the Market

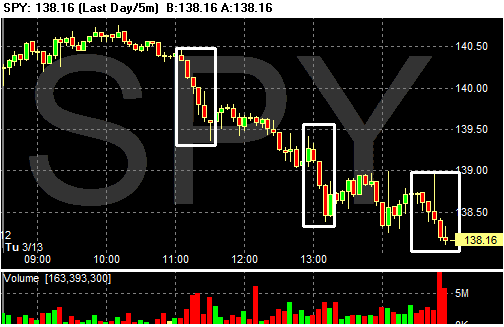
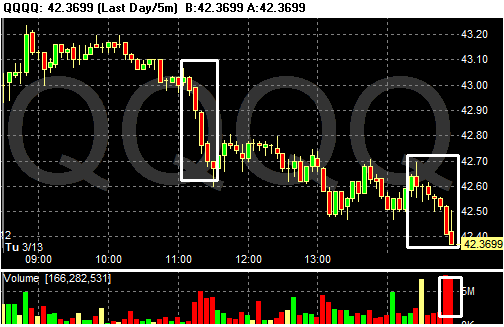
Wow -- what a sell-off. First, let's look at the charts. I should mention that my daily charts come from Quotetracker. I don't endorse or not endorse that software -- it's just where my charts come from .

Here are today's charts in the following order:

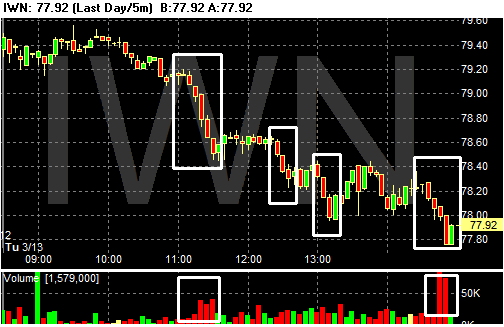
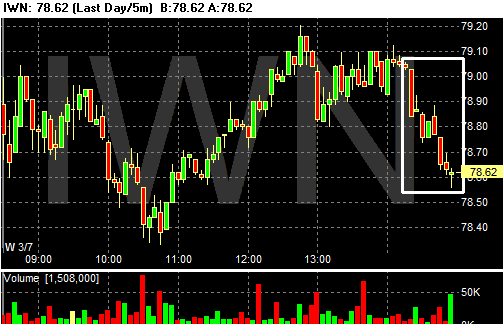
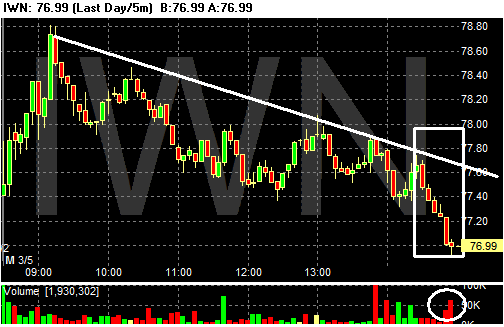
SPY, QQQQ, IWN

Photo Sharing and Video Hosting at Photobucket

Photo Sharing and Video Hosting at Photobucket

Photo Sharing and Video Hosting at Photobucket

The markets first tumbled a bit after 11 EST. Notice the three really strong downward bars on strong volume. This indicates there were a ton of sellers and they were in complete control.

About 12:30 the IWNs sold-off. Remember the Russell 2000 have performed slightly better for the last few sessions, meaning there were more profits to book.

All the averages tumbled again at 1300 and the QQQQs and SPYs had a volume spike at this time. Again -- a ton of sellers enter the market and they are in complete control of all the action.

Notice how all the averages died at the end on extremely heavy volume. This was literally a, "Katy bar the door" moment in the market when everybody wanted to get out.

Also note the markets continued to trade down throughout the day and closed near session lows. These are all bearish signs. The continual downward trend indicates the market could not find a bottom during trading. Closing near a low, on a sell-off on very high volume indicates people were dumping shares. That means they are nervous about what news might come out tonight and tomorrow morning.

According to Briefing.com:

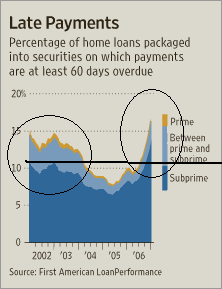
If the problems in the subprime mortgage market have got you down, the Mortgage Bankers Association didn't do anything today to lift your spirits. If anything, it dampened them even further with a declaration that delinquencies among subprime borrowers hit 13.33% in the fourth quarter, which is the highest rate since the third quarter of 2002.


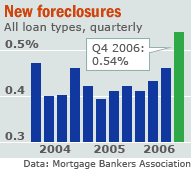
Here's a chart from CBS Marketwatch that shows the foreclosures:

Photo Sharing and Video Hosting at Photobucket

In addition, the NYSE delisted New Century Financial which was the second largest subprime mortgage lender in the country until recently.

We also had a bad retail sales report, which indicates housing problems may be spilling over into other areas of the economy.

So, adding all of this up, we get a market that has concerns about the housing market, some general fear left-over from the most recent slide and overall concern the housing slowdown is seeping into other areas of the economy like consumer spending.

The bears are making their voices heard.

Late Mortgage Payments At 3-year High

Special thanks to Bonddad's wonderful girlfriend for this.

From MSNBC:

Late mortgage payments shot up to a 3½-year high in the final quarter of last year and new foreclosures surged to a record high as borrowers with tarnished credit histories had trouble keeping up with their monthly payments.

The Mortgage Bankers Association, in its quarterly snapshot of the mortgage market released Tuesday, reported that the percentage of payments that were 30 or more days past due for all loans tracked jumped to 4.95 percent in the October-to-December quarter.

That marked a sharp rise from the third-quarter’s delinquency rate of 4.67 percent and was the worst showing since the spring of 2003, when the late-payment rate climbed to 4.97 percent.

....

The percentage of mortgages that started the foreclosure process in the final quarter of last year rose to 0.54 percent, a record high. The previous high, 0.50 percent, occurred in the second quarter of 2002 as the economy was recovering from the blows of the 2001 recession.

Delinquency and foreclosure rates were considerably higher for higher-risk “subprime” borrowers, especially those with adjustable-rate mortgages.


Let's look at those specifics.

1.) Late payments are at a 3.5 year high.

2.) New foreclosures are at a record high.

3.) The last time foreclosures were at this level was after a recession -- a period of lower economic activity. as the US economy is slowing, it's fair to say this level of foreclosures before a possible recession does not bode well.

Markets Tanking

As of this writing, the QQQQs and SPYs are down about 1% and the IWNs are down 1.75%. All of the press is blaming the subprime market.

Retail Sales Up .1%

From the Commerce Department:

The U.S. Census Bureau announced today that advance estimates of U.S. retail and food services sales for February, adjusted for seasonal variation and holiday and trading-day differences, but not for price changes, were $370.5 billion, an increase of 0.1 percent (±0.7%)* from the previous month and up 3.2 percent (±0.7%) from February 2006. Total sales for the December 2006 through February 2007 were up 3.7 percent (±0.5%) from the same period a year ago. The December 2006 to January 2007 percent change was unrevised from 0.0 percent (± 0.3%)*.

Retail trade sales were up 0.2 percent (±0.7%)* from January 2007 and were 3.1 percent (±0.8%) above last year. Nonstore retailers were up 9.1 percent (±4.5%) from February 2006 and sales of health and personal care stores were up 6.1 percent (±1.7%) from last year.


Bloomberg adds more:

Retail sales in the U.S. rose less than forecast last month as an increase in gasoline prices limited spending on other goods.

The 0.1 percent gain followed no change in the prior month, the Commerce Department said today in Washington. Sales excluding service-station receipts were unchanged as the return of colder weather discouraged shoppers.

The figures point to a gradual slowdown in consumer spending that Federal Reserve Chairman Ben S. Bernanke called a ``mainstay'' of the expansion. Fewer purchases, combined with the downturns in housing and manufacturing, make it less likely that growth will accelerate in coming months.

``Once we disentangle the effect of higher gasoline prices on service-station receipts, we see a modest amount of consumer spending,'' Ken Mayland, president of ClearView Economics LLC in Pepper Pike, Ohio, said before the report. ``It appears consumer spending is something short of healthy.''


Are consumers finally starting to slow down their continual appetite for new stuff?

Hiring Plans Diminish

From IBD:

A net 18% of firms plan to add staff in Q2, according to Manpower's latest jobs survey. That's the lowest since early '04. Construction firms have slashed hiring plans. Factories and service firms also have cut back. It's the latest evidence of easing labor markets. Fri.'s Feb. job report showed the weakest hiring in 2 years. Jobless claims also have trended up.


While plans can always change, this is not good news on the employment front.

Subprime Problems Will Impact New Home Sales

From the WSJ:

The rapid unraveling of the subprime-mortgage industry is stirring new concerns about the already weak housing market.

A report released yesterday by Credit Suisse analyst Ivy Zelman forecast that credit tightening for financially stretched borrowers will lead to a 20% drop in new-home sales in 2007, to about 890,000, as buyers find it more difficult to borrow for homes.

Coupled with a general waning in demand for housing and the exodus of speculators from the market, Ms. Zelman expects that credit tightening will cause housing starts to drop 35% to 45% through this year and into 2008 from their peak annual rate of 1.8 million units in January 2006.


Credit Suisse is the first company that predicted the rapid increase in the default rate of the subprime mortgage industry.

Anatomy of a Subprime Default

From the WSJ:

Amid mounting defaults in the market for subprime mortgages, some big banks and mortgage companies are striking out in their efforts to wrest compensation from originators of those high-risk, high-return loans.

Led by HSBC Holdings PLC, banks and others are trying to force small mortgage lenders to buy back some of the same loans the banks eagerly bought in 2005 and 2006, by enforcing what the industry calls repurchase agreements. Squeezed by the onslaught of defaults, many originators are saying they can't afford to buy back their loans or are pursuing bankruptcy protection.


This is a standard part of the securitization industry. Here's how it generally works.

1.) Subprime company makes loan.

2.) Subprime company sells loan to larger bank.

3.) Larger bank pools loan with other, similar loans (same interest rate, same maturity etc....) and then sell pools to various investment groups (insurance companies, mutual funds etc...).

As part of step 2, the subprime originator agrees it will repurchase a loan under certain conditions, one of which is usually a specific delinquency rate.

Although the specifics vary from deal to deal, repurchase agreements obligate the mortgage originator, under some circumstances, to buy back a troubled loan sold to a bank or investor. That obligation sometimes kicks in if the borrower fails to make payments on the loan within the first few months or if there was fraud involved in obtaining the original mortgage. The total volume of mortgages nationwide that might meet those criteria isn't known, but such agreements cover billions of dollars in mortgages.


When a large number of loans go into delinquency early, the larger banks can flood the subprime originator with repurchase requests. This can bankrupt the subprime originator which is exactly what is happening right now.

This is why there have been so many problems in the subprime originators for the last few months.

New Century said yesterday that, starting last Wednesday, it had received a wave of default notices from its major Wall Street creditors, and may owe creditors a combined $8.4 billion for mortgage repurchases. It said if all its lenders demand repurchases, it can't afford to pay. That could force the company into bankruptcy proceedings, where it would join scores of others hurt by the industry meltdown.


That's a a whole lot of money. Considering New Century relies on lines of credit from the same large investment banks to finance its operations, New Century is obviously in a world of hurt.

Robert Napoli at Piper Jaffray said assuming a 20% loss rate on loans it is forced to buy back from its creditors, New Century "would have to absorb $1.6 billion of losses, essentially wiping out shareholders equity." As of Sept. 30, the company listed $25 billion in assets, about $23 billion in liabilities and $2 billion in shareholders' equity.


From a balance sheet perspective, this is a huge deal. Essentially, the owners/stockholders see their actual ownership interest wiped out overnight. Imagine if you were part owner of a company and you just woke up to discover your ownership interest -- which was pretty decent yesterday, is now worth nothing 24 hours later.

Loose credit standards are a prime culprit in the problems:

HSBC's borrowers included people who couldn't make their first mortgage payments as well as people who misrepresented their income or employment on their mortgage applications, interviews and HSBC's court filings show.


There's also a large amount of "whose left holding the bag" going on -- as in, who is being stuck with the loss.

When it is unable to claim its money or believes it will be unable to, HSBC must write off the loans. In 2006, the bank said the loan-impairment cost totaled $6.68 billion for its main U.S. consumer finance business. That was 34% higher than in 2005. The bank has said it may take two to three years to work through its problem loans.

HSBC's top finance chief acknowledges the difficulties in trying to enforce repurchase agreements. "It's proving quite difficult in the sense that many of the parties...don't have the wherewithal" to repurchase the loans, said HSBC Finance Director Douglas Flint.


Short version of all this -- it's a big damn mess.

Monday, March 12, 2007

Market Overview

Here are the averages in the following order: SPY, QQQQ, IWN

Photo Sharing and Video Hosting at Photobucket

Photo Sharing and Video Hosting at Photobucket

Photo Sharing and Video Hosting at Photobucket

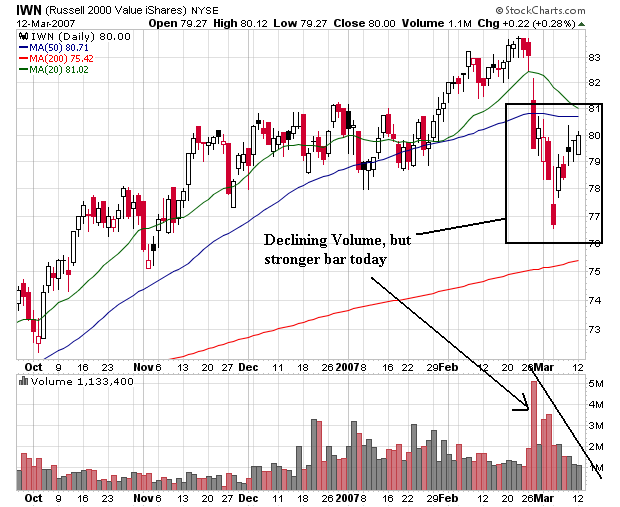
All three averages are settling down in terms of volume, which has declined gradually from the selling peak a few weeks ago.
Notice all three averages have a somewhat weaker rally. All averages contain weaker candle bars -- bars with shorter bodies and longer shadows. Also note the rallies occurred on declining volume -- a bearish sign. However, because the markets are coming off of very high volume days, the declining volume may not have as strong a bearish implication.

With the IWNs note today's strong bar. There is no lower shadow and the market closed near its high. This is called a bullish engulfing pattern, and it is considered a bullish signal. While the volume total does not confirm it, the size of today's body may indicate traders are looking at small caps again.

It still looks to me like that averages are looking for direction. While all three are technically in an uptrend, the inner-dynamics of the uptrend just aren't that strong.

As with all TA -- the markets will make an ass of you whenever and wherever possible.

The Markets Today

SPY: +.13%
QQQQ: +.54
IWN: +.21

Photo Sharing and Video Hosting at Photobucket

Photo Sharing and Video Hosting at Photobucket

Photo Sharing and Video Hosting at Photobucket

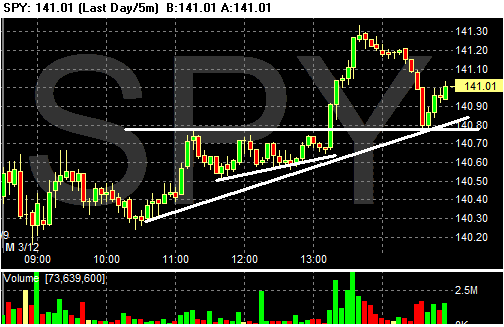
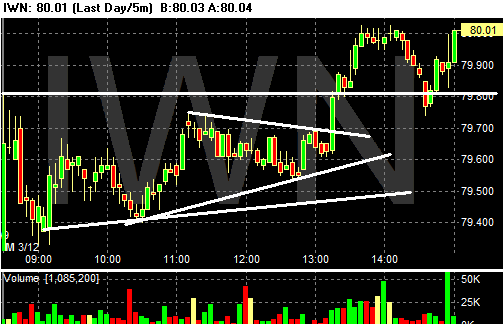
Notice:

1.) All of the averages had an upward bias throughout the day.

2.) All three averages sold-off after their rally.

However --

The IWNs rallied back to close near their daily highs and the QQQQs rallied as well, although they closed off their peaks. Both averages rallied on increasing volume, which is bullish.

The SPYs rallied as well, although they were less than inspired in their trading.

All three averages showed a break-out, sell-off that tested certain levels followed by a rally. Those events are generally considered to be bullish.

More Subprime Problems

New Century Financial loses funding:

New Century's woes deepened on Monday after the stricken subprime mortgage firm said its lenders are cutting off credit.
The NYESE delayed the opening of trading in New Century shares 9:30 a.m. Eastern, pending a news announcement, according to market sources.

The stock had dropped 56% to $1.42 in pre-market trades on the mortgage lender's latest credit woes.

The firm said in a filing with the Securities and Exchange Commission Monday that lenders under its short-term repurchase agreements and aggregation credit facilities had either discontinued their financing or notified the company they plan to do so.


Bloomberg added this:

New Century Financial Corp., the nation's second-biggest subprime lender, said today it doesn't have the cash to pay creditors who are demanding their money now, increasing speculation that the company will go bankrupt.

Shares of the Irvine, California-based company, already down 90 percent in 2007, lost half their remaining value in pre-market trading. New Century said in a federal filing it doesn't have funds to give to lenders including Morgan Stanley, Citigroup Inc. and Goldman Sachs Group Inc. The creditors want New Century to repurchase all outstanding mortgage loans they financed.

``They're one step closer to bankruptcy,'' said Bose George, an analyst at Keefe Bruyette & Woods in New York who rates the shares ``market perform.'' ``The only possibility for survival now is for someone, potentially an investment bank, to step in.'' Bose said a rescuer might provide more money in return for a large equity stake.


This is not a Mom and Pop storefront. It's the second largest subprime lender in the country. That should indicate the degree of problems the industry is facing right now.

Yield Curve Says Recession -- Still

From Bloomberg:

The probability the U.S. economy will shrink for two quarters has risen to 50 percent, according to a model created when Greenspan ran the Board of Governors of the Federal Reserve System. The formula is based on differences in yields on Treasuries.

The economy has gone into recession six of the seven times since 1960 that short-term interest rates topped longer-term bond yields, as they do now. The difference between three-month bills and benchmark 10-year notes is close to the widest since 2001. Investors say the so-called inverted yield curve is a sign the Fed will cut borrowing costs because the economy is decelerating.


Here is something that I haven't written about in awhile -- the inverted yield curve. Short-term rates have responded to the Fed's interest rate hikes while the long-term part of the curve thinks inflation is at least in check for now. That means market participants think the economy is slowing and possibly moving into a recession.

The argument can be made that long-term rates are in fact responding to foreign direct investment in the US. However, this argument forgets to acknowledge that these investors wouldn't invest in US debt if inflation was an issue.

The short version is the yield curve is inverted, has been for some time and that is usually a sign of an approaching recession.

China To Invest Reserves More Aggressively

From the WSJ:

Minister of Finance Jin Renqing on Friday said the reserves will be split into two and managed differently. "'Normal' foreign-exchange reserves will continue to be managed by the State Administration of Foreign Exchange," Mr. Jin said. "Separately, a foreign-exchange investment company will be set up under the leadership of the State Council," he said, referring to China's executive branch.

He didn't say what portion of the reserves might be channeled through the new investment company or when it would start to operate. He also didn't specify whether the reserves might be spent to achieve nonfinancial goals. Some government officials in charge of energy and industry policy have called for using the funds to buy natural resources or key technologies.

"In carrying out the investment management of this foreign exchange, we will strive to achieve greater profits and benefits with the prerequisite of maintaining safety," Mr. Jin said.


How quickly the communists have become profit seeking capitalists...

Seriously, I don't know why it was taken them this long to more aggressively manage their foreign reserves. They do have over $1 trillion, after all.

Additionally, China has made a ton of deals over the last 5 years, essentially promising large amounts of cash for investment in return for access to raw materials. The South American landscape is littered with such deals.

China isn't the only country doing this. There is another Asian country who is also doing this, although I can't remember which one. Any help jostling my memory would be appreciated.

Sunday, March 11, 2007

Tougher Lending Standards May Increase Housing Problems

From Gannett:

Since the start of the year, more lenders have been shutting their doors to people like Booker, just as those homeowners' interest rates are rising. They're slashing the "Bad credit? No problem" types of loan programs, known as subprime, that helped fuel the housing boom. And they're raising the bar for homeowners and first-time buyers to qualify for new loans.

The trend accelerated last week after federal regulators proposed stricter guidelines for banks that make subprime ARMs (adjustable-rate mortgages). The move followed Freddie Mac's decision to drastically raise the criteria for the subprime ARMs it would buy and to require better proof of a borrower's finances.

The industry is reacting to the waves of subprime borrowers who've defaulted on their ARMs in recent months. The tighter controls should help prevent future borrowers from getting in over their heads and protect them from predatory lenders. But the sudden shift in lending rules could also threaten the homeownership gains made by families since 2000, weaken the recovery of the housing market and potentially slow the economy.


As lenders tighten their standards higher risk borrowers who want to refinance their respective loans are facing problems. This will probably make the current housing market problem of high inventory a whole lot worse.

Sub-Prime Problems Moving Into Other Loan Areas

From CBS MarketWatch:

Problems in the subprime mortgage business may be spreading to other parts of the home loan market.

Losses are creeping up on so-called Alt-A loans, which are considered less risky than subprime mortgages, but may have lower credit quality than "prime" loans.

Alt-A loans were originally designed for borrowers with clean credit records, but with other issues that often meant they provided fewer documents or even no documents showing what they earned. These loans were attractive to mortgage investors because they offered higher yields than traditional "prime" home loans, but were underpinned by the cleaner credit records of the borrowers.

The popularity of Alt-A mortgages exploded in recent years. A record $400 billion of these loans were originated in 2006. They accounted for 13.4% of all mortgages offered last year, up from 2.1% in 2003, according to industry publisher Inside Mortgage Finance.


This was bound to happen -- it's not a matter of if, but when.

Notice the following points.

1.) The amount of these loans has increased from 2.1% of all loans in 2003 to 13.4% in 2006. That's a 6 fold increase. That indicates the degree of credit degradation that has occurred in the lending business during the housing bubble.

2.) The article goes on to state that Alt-A loans have absorbed some subprime loans. That means the subprime numbers being reported are too low; they are actually worse than reported. Not good.

3.) Financial companies make up the largest percentage of the S&P 500. That means the largest sector in that market average will be under increased selling pressure if these stories persist.

Current Subprime Problems = "Tip of A Wave"

From Bloomberg:

The nation's banks are just beginning to feel the pain of defaults on risky mortgages they made at low introductory rates when housing prices were soaring, U.S. Federal Reserve Governor Susan Bies said.

Bies, who has been the Fed's top banking policy official in her tenure at the U.S. central bank, said today banks are likely to see more missed payments and foreclosures as consumers with weak credit histories begin to face higher monthly mortgage payments.

``What's happening is the front end of this wave of teaser- rate loans that are coming into full pricing,'' Bies said at a risk-management forum in Charlotte, North Carolina. ``So what we're seeing in this narrow segment is the beginning of the wave. This is not the end, this is the beginning.''


Depending on which news source you read, there are between $700 billion and $1 trillion of subprime loans that adjust this year. That means we have 9 more months of possible problems.

In addition, when a Fed official uses the phrase "tip of the iceberg" you know you've got some possible problems coming down the pike.

Saturday, March 10, 2007

Saturday = Day Off

Go and do something else aside from economics and market watching.

I'll be back tomorrow afternoon.

Friday, March 9, 2007

The Markets Today

SPY: -.01%
QQQQ: +.05%
IWN: +.48%

Translation: money flowed into the small cap market today. Everybody else was scratching their heads.

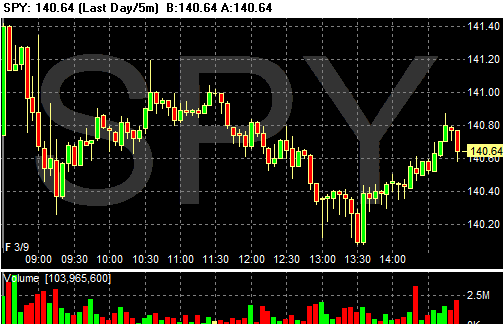
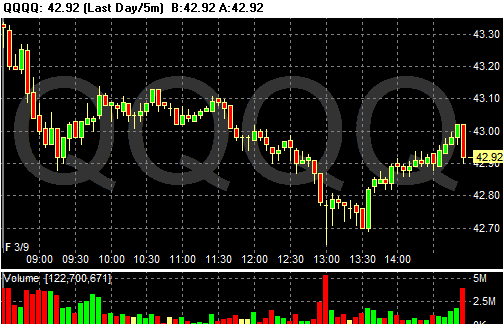
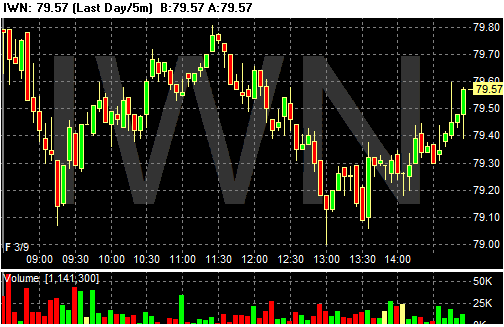
Looking at the charts, we have a lot of meandering in the SPYs and QQQQs. They opened higher, dropped, moved around, sold-off then rallied. The IWNs at least closed higher.

Photo Sharing and Video Hosting at Photobucket

Photo Sharing and Video Hosting at Photobucket

Photo Sharing and Video Hosting at Photobucket

Payrolls + 97,000

First a disclaimer. The BLS has revised this number a great deal. Recently they reported they added an additional 800,000 jobs to the 2006 totals. Clearly their current model is pretty flawed.

In today's report we learn the BLS found an additional 35,000 jobs in January with their upward revision for the month.

Be that as it may....


Here's a link to the report.

Construction lost 62,000. The housing slowdown is starting to hit employment numbers. I would expect this number to continually worsen over the next year as the housing slowdown starts to bleed into the rest of the economy.

Here's how the BLS reported it:

In the goods-producing sector, construction employment fell by 62,000 in February after posting a gain of 28,000 in January. Unusually severe winter weather conditions in some areas of the country in February likely contributed to job losses in the industry. Employment declined in both residential (-21,000) and nonresidential (-25,000) specialty trades, and heavy construction lost 10,000 jobs. Employment in residential specialty trades has been declining since February 2006.

Manufacturing employment continued to trend down over the month (-14,000). Job losses occurred in wood products (-4,000), semiconductors and electronic components (-3,000), and textile mills (-3,000). Machinery added 5,000 jobs in February. In mining, employment rose by 4,000.


The rest of the gains were split between professional, business and leisure jobs.

While total private hourly earnings increased 6 cents, hours worked decreased by .1%. Decreased hours usually makes increased wages a wash.

In the service-providing sector, health care employment rose by 33,000 in February, as job growth continued throughout the component industries. Over the year, health care employment has increased by 340,000.

Employment in professional and business services continued to trend up in February (+29,000) with small gains occurring in most of its component industries. Over the past 12 months, this industry has added 460,000 jobs. In February, employment in services to buildings and dwellings grew by 11,000. Temporary help services employment was little changed over the month and over the year.

Elsewhere in the service-providing sector, food services and drinking places added 21,000 jobs in February. Over the year, food services employment has risen by 348,000. Employment in the information industry was up by 13,000 in February. Within financial activities, depository credit intermediation added 4,000 jobs. Over the month, employment was essentially unchanged in both wholesale and retail trade. Air transportation lost 7,000 jobs.


The last few employment reports have all showed a slowing economy -- even with the subsequent revisions. This report clearly falls within that as well. In addition, we're seeing housing really hit employment. Earlier this month housing starts dropped 16%. That means housing related employment will one decrease further.

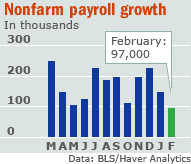
Here's a chart from CBS Marketwatch of the last year of job growth:

Photo Sharing and Video Hosting at Photobucket

New Century Financial Stops Making Loans

From the WSJ:

In the clearest sign yet of how rapidly funding is vanishing for the risky loans that helped fuel the housing boom, nervous creditors forced New Century Financial Corp., the nation's second-largest subprime mortgage lender, to stop making new loans.

The Irvine, Calif., company, which has been plagued by rising defaults on its subprime mortgage loans -- home loans made to borrowers with weak credit -- said it has been in talks with its creditors to "identify ways to address their concerns" and obtain more funds in the near term. But it added that "there can be no assurance that these efforts will succeed."

Yesterday, people close to the matter said New Century got fresh financing from one of its biggest creditors, investment bank Morgan Stanley. Even so, the company's mounting woes intensified speculation that it may be forced to file for protection from creditors under Chapter 11 of the federal Bankruptcy Code unless it can find a suitor or sell assets soon.


I doubt this will be the last we will hear of New Century Financial or the subprime market.

Subprime Problems May Increase Housing Inventory

From Bloomberg:

Rising mortgage defaults by subprime borrowers may add more than 500,000 homes to a residential real estate market already beset by slumping prices, according to CreditSights Inc.

In January, 4.09 million new and existing homes were offered for sale, down from 4.43 million in July 2006, the National Association of Realtors and the U.S. Commerce Department said. New homes accounted for 536,000 of the January total, down from a record 573,000 in July.

A five-year housing boom that ended a year ago was fueled in part by the growth of mortgage products marketed to borrowers with poor credit histories. Now, as defaults on subprime loans surge to a seven-year high, more than 20 lenders have closed or sought buyers since the start of 2006. The survivors are raising their lending standards.

``We estimate that the effect of looser lending standards could translate into another 533,000 homes coming onto the market as borrowers default -- an unwelcome phenomenon given the existing supply surplus,'' Sarah Rowin and Frank Lee of bond research firm CreditSights wrote in a March 1 report.


Existing housing inventory is one of the reasons I have been bearish on the housing market.

Housing inventory is expressed as "months available for sale given current sales rates." Another way to put this is "how many months would it take to clear existing inventory at current sales rates?" According to the Census Bureau there are currently enough new homes on the market for 6.8 months of sales at the current sales rate. This number has jumped around between 5.2 and 6.8 for the last year. Eyeballing the numbers, it looks like the lower 6s is about the median.

According to the National Association of Realtors there were 3.549 million existing homes on the market in January or 6.6 months of inventory. An increase of 500,000 would increase that level to a little over 4 million. Those totals won't come onto the market all at once. Instead, they will come onto the market gradually, which will make clearing existing inventory that much more difficult.

More on Retail Sales

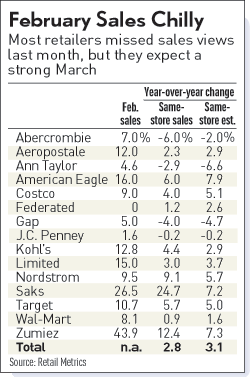
This is a graph from Investors Business Daily

Photo Sharing and Video Hosting at Photobucket

Note that sales are still growing, but they are coming in below where analysts thought they were.

Here's the salient points from IBD:

February's soft showing came in the wake of solid January sales gains, lifted by a late month cold snap. As a result, retailers entered February with much of their winter goods cleared — and well stocked for spring.

But when the cold hit, shoppers didn't want spring apparel and couldn't find coats or sweaters.

"In February the last thing you wanted to buy was a spring outfit," Perkins said. "And if you were going to buy for now there wasn't much in the stores."

The month's adverse weather held down February same-store sales by at least half a percentage point, said Michael Niemira, chief economist at the International Council of Shopping Centers.

Because February typically has the year's second lowest sales volume behind January, one shouldn't extrapolate too much from the month's results, he said.


Also, read The Big Pictures hilarious take on the recent news in retail sales.

Thursday, March 8, 2007

Daily Market Charts

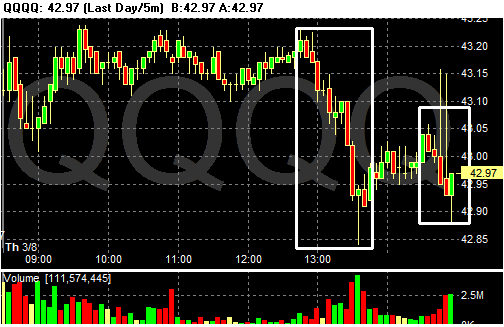
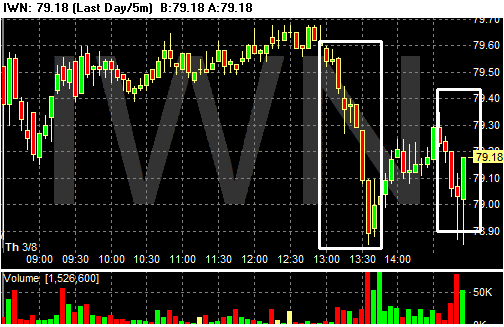
Because the employment report is so important right now, I think it's a good idea to get a look at the daily market charts before the news release. I think they all say pretty much the same thing, so here they are in the following order: SPYs, QQQQs IWNs

Photo Sharing and Video Hosting at Photobucket

Photo Sharing and Video Hosting at Photobucket

Photo Sharing and Video Hosting at Photobucket

We had the big down day, followed be a slightly less pronounced decline. All three charts have a classic candlestick hammer style bottom. While we had a relief rally over the last few sessions, notice it's been on declining volume. In addition, the candle bars of the rally are weak -- the open and closes are very close. All of these factors can signal the rally is losing steam and traders are looking for a reason to sell. In addition, all three averages are approaching their respective 10-day moving averages, which could be a resistance line for all three.

Again, this is not set in stone. We're simply trying to play the averages about what could happen.

The Markets Today

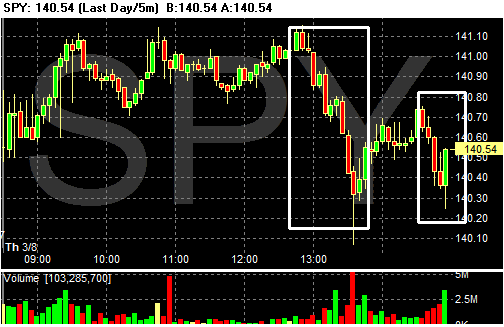
The closing price indicates this was a good day -- the SPYs were up .76%, the QQQQs were up .91% and the IWNs were up 1.03%. But we had two big sell-offs -- one during the last half hour of trading. Traders are obviously nervous about tomorrows employment report.

In addition, note how the markets spiked up at the beginning, but couldn't hold onto these gains throughout the day. This further indicates nervousness.

Photo Sharing and Video Hosting at Photobucket

Photo Sharing and Video Hosting at Photobucket

Photo Sharing and Video Hosting at Photobucket

Housing and Employment

Big thanks to Bonddad's girlfriend for this from MSNBC:

Now the housing slump is hitting yet another target: housing-related jobs, a list that includes everyone from the people who build and sell houses to makers of appliances and furnishings.

That's a sharp contrast to the height of the housing boom in 2005-06, when the industry was responsible for creating some 25,000 to 50,000 new jobs every month, according to Mark Zandi, chief economist at Moodys.com.

“In the recent months it’s been laying off workers at a pace of 25,000 to 50,000 per month,” he said. “And I think the next couple of quarters we’ll start seeing job losses of between 50,000 and 75,000 per month. ... I think the housing market is going down a whole other notch.”


I looked at housing and employment about 6 months ago. A conservative reading of job growth puts housing related jobs at about 30% of total growth for this expansion. That's including construction, financial and professional services. In other words, housing is really important to this expansion.

The blog Calculated Risk has estimated that between 200,000 to 400,000 jobs will be lost as housing cools. Additionally, we really haven't started to see the big drop because housing starts are just starting to slow. Business construction may absorb some of these losses, but as of now we don't know how many.

Retail Sales Disappoint

From Bloomberg:

The coldest February since 1979 caused U.S. retailers' sales to grow at the slowest pace in 11 months as consumers delayed purchases of spring merchandise.

Wal-Mart Stores Inc., the world's biggest retailer, said sales at stores open at least 12 months rose 0.9 percent, less than the company's forecast of 1 percent to 2 percent. Luxury stores and retailers with designer clothes, including Target Corp., the second-largest U.S. discount chain, fared better, with sales surpassing analysts' estimates.

Total U.S. same-store sales rose 2.4 percent, the smallest gain since March 2006, the International Council of Shopping Centers said based on results from 51 retailers. The majority of retailers missed estimates after cold weather cut demand for shorts, dresses and spring merchandise, while a snowy Valentine's Day in the U.S. Northeast kept some shoppers home.

``We hate to hear weather as an excuse, but I think it was pretty legitimate this month,'' said Lori Wachs, who helps manage $100 billion at Philadelphia-based Delaware Investments, including retail shares. Retailers ``are going to have a lot of ground to make up in March.''


This is another piece of bad economic news this week. We had a drop in durable goods and productivity and higher labor costs. The Beige Book was slightly optimistic, but noted it had concerns with housing. It also said nothing had change on the inflation front, implying rates aren't coming down anytime soon.

While this report isn't horrible because sales are still positive, its weakness may imply the consumer is slowing down his retail purchases.

Memo to Employers: Lose the Second Yacht

Photo Credit: Jared Rodriguez 
Why is Pace University making it so hard for Chris Williams to get a union contract? 
The U.S. House passed legislation last week that would level the playing field for employees trying to form a union—but judging by the reaction in the business community, you’d think the bill is the end of corporate freedom as we know it.

On March 1, the House voted 241–185 for the Employee Free Choice Act, which would establish stronger penalties for violation of employee rights when workers seek to form a union and during first-contract negotiations. It also would allow employees to form unions through a majority verification process, in which workers sign cards to indicate their support for a union.

In attacking the bill, Big Business has misleadingly insisted it would take away the secret ballot election process by which workers now form unions. But that argument is a red herring. First of all, Employee Free Choice Act doesn’t take away the secret ballot process. Workers will have a choice between the ballot process and majority verification.

Second, as currently run by the nation’s labor board, this management-controlled election process is anything but democratic. The long, drawn-out process gives management plenty of time to harass and intimidate workers—and let’s face it, how many people want to join a union if their employer threatens to fire them (which 25 percent of private-sector employers do, even though it is illegal)?

Former Labor Secretary Robert Reich puts it this way:
A secret ballot sounds democratic, but workplaces aren’t democracies because employers have the power to hire and fire. That's where the potential for intimidation lies. And the only way around it is to go with a simple up-or-down vote.
There are many examples of how the so-called “election process” doesn’t work. Chris Williams, an adjunct physics professor at Pace University in New Jersey, shared his story with us at the AFL-CIO. In December 2003, Williams and a majority of his co-workers signed authorization cards saying they wanted to be represented by New York State United Teachers/AFT (NYSUT/AFT). Pace University's administration then went to enormous lengths to block them from winning recognition and a contract. (A majority of workers can sign authorization cards now—but employers are not required to recognize the union. The Employee Free Choice Act would fix that.) Why would Williams, a well-educated professional, want to join a union? Says Williams:
I would starve to death if I had to rely on my wages from Pace. I'd be homeless. The average pay for an adjunct for a three-credit course is just $2,500 for a 15-week course.
While a tenured professor might earn $100,000 per year, an adjunct faculty member in the next classroom with the same qualifications would earn subsistence pay of only $15,000 for the equivalent of a full-time workload. (What was that again from the Bush administration about lack of education behind the nation’s low-wage economy? We’ll address that canard in a future post.)

The adjunct faculty then tried the election process route of the National Labor Relations Board (NLRB). First, the university tried to delay the election. Then, after the election was held in spring 2004 and the adjunct faculty voted overwhelmingly for the union, the university came up with a bizarre legal argument that hundreds of adjunct faculty members should be excluded from the bargaining unit. It actually refused to include them in negotiations with the union. The director of NLRB's Region 2 found the disputed adjunct faculty members were part of the bargaining unit, and the five-member NLRB in Washington, D.C., rejected a request by the university to have the region's decision overturned. But even now, Pace is appealing the decision to the federal appeals court. That postpones the adjunct faculty's rights even longer. So a staggering two-and-a-half years of negotiations have passed and the adjunct faculty still has no contract.

That's why Williams, who sees firsthand the flaws in the current system, supports the Employee Free Choice Act, which provides for mediation and then arbitration if managements and unions can't work out a contract in 90 days.

So, given that most businesses are not interested in running their workplaces like a democracy (“How many people want a four-week vacation? Raise your hands”), we thinketh they doth protest too much that the bill would take away this nonexistent freedom.

Business interests also say workers would be “coerced” into joining a union through the majority verification process. That presumes most workers don’t want to join a union. That presumption is wrong. In fact, some 60 million U.S. workers say they would join a union if they could, based on research conducted by Peter D. Hart Research Associates in December 2006.

Commenting on the American Chronicle, Stephen Crockett, co-host of Democratic Talk Radio, points out how employer cries of intimidation are directed in the wrong direction.
The intimidation is almost entirely on the side of the companies. Companies are in a position of power over workers. Co-workers are simply not in a similar power situation. Only the company is really in the kind of power position to intimidate workers.
Most critically, the bill is about economic justice: Full-time workers in unions had median weekly earnings of $833 in 2006, compared with $642 for their nonunion counterparts, and are far more likely to have good health and retirement security. In March 2006, 80 percent of union workers in the private sector had jobs with employer-provided health insurance, compared with only 49 percent of nonunion workers. Union workers also are more likely to have retirement and short-term disability benefits.

And its here—in the dollars and cents—we find the real reason for employer opposition to the Employee Free Choice Act. The past two decades have seen an unprecedented growth in compensation only for top executives and a dramatic increase in the ratio between the compensation of executives and their employees. The average CEO made 411 times the salary of the average worker in 2005. That’s up from 42 times in 1980—a tenfold increase. Meanwhile, average worker's pay increased to about $43,000 in 2004 from about $36,000 in 1980, an 0.8 percent a year increase—about 19 percent total increase—in inflation-adjusted terms.

The average CEO of a Standard & Poor's 500 company made $13.51 million in total compensation in 2005, according to an analysis by The Corporate Library. And that's just the annual take. Seems like what CEOs really fear about the Employee Free Choice Act is that by granting their workers family-supporting wages and health care and retirement security, they might have to forgo that second yacht.

Again, Robert Reich:
America's rising economic tide has been lifting executive yachts, but leaving most working people in leaky boats. Workers need more bargaining power. They should be allowed to form a union when a majority of them wants one. As simple as that.
Beige Book is Out

The Federal Reserve Issued the Beige Book yesterday. Here's a link to the report.

Here are some highlights from various news sources:

WSJ:

The report found "modest expansion in economic activity" in many districts, including the regions centered on Chicago, Minneapolis and Philadelphia. But some districts noted some slowing, including Dallas, Boston and St. Louis. It also noted continued demand for skilled workers and some pressure to increase wages


From CBS Marketwatch:

Housing markets remained weak, although there were "signs of stabilization" in some areas.

Manufacturing activity was "steady or expanding," despite the weakness in auto- and housing-related production.

Retail sales were said to be growing steadily. Auto sales were sluggish.

Inflation was "little changed." Pay increases were "moderate."


From Bloomberg:

The general tone of the report was upbeat, describing continued growth in retail sales, services and demand for labor. Policy makers are alert for signs of a deeper economic slowdown after last week's global equities rout and reports showing a prolonged decline in housing.

``I still think that the underlying economic fundamentals are conducive to a pickup in growth as we move through 2007 and 2008,'' Chicago Fed President Michael Moskow said today in a speech in Chicago. ``I am not prepared to significantly change my projections.''


From Reuters:

Policy-makers expect the economy to slowly pick up after losing steam in the fourth quarter as housing cooled. The Beige Book nodded to hopes that this sector might finally be on the mend, while softness among manufacturers remained confined to autos and products linked to residential construction.


I would encourage everybody to read the full report and all of the news articles as they provide some of the best insight into what the Federal Reserve policy makers are thinking.

Hedge Funds and Sub-Prime Lenders

From the WSJ:

Hedge-fund investors betting on the riskiest home-mortgage loans are learning a difficult lesson: The higher they fly, the further they fall.

Consider the volatility at Second Curve Capital -- a hedge-fund firm run by Thomas Brown, a former Wall Street research analyst -- which recently has been hammered betting on the stocks of "subprime" lenders, which cater to high-risk borrowers.

The two main funds at Second Curve were down 8% and 10% in January -- and at least as much last month. Hedge-fund databases show the funds' losses for February at 12.5% and 14%, though Mr. Brown contends that the performance was comparable to January.

In any case, it is a significant turnabout from 2006, when the Second Curve funds rose nearly 55%. In 2005, Mr. Brown's funds were down 2%, after soaring 60% in 2004. With $600 million under management, Mr. Brown tends to invest in highly concentrated areas of the financial world, accentuating the bumps.


Live by the subprime, die by the subprime.

Seriously, this highlights an interesting and perhaps difficult problem in the market. Hedge funds don't make any disclosure reports to the SEC. Therefore, we don't know what they are investing in. We also don't know how many hedge funds are investing in the subprime mortgage area or in what concentration.

This means there could be a few more hedge funds out there reeling from the subprime shakeout. This could lead to a wave of redemptions and a ton of problems in the market.

Wednesday, March 7, 2007

DR Horton: "2007 Is Going to Suck"

From CNN:

"I don't think '08 is going to be a great year, but it's going to be much better than '07," CEO Don Tomnitz told the Citigroup Industrial Manufacturing Conference

He also said: "'07 is going to suck."

D.R. Horton said it may have to make further write-offs to reflect unsold homes or lower land values.

"We may have more impairments coming," Tomnitz said. "We'll know that on a quarter-by-quarter basis."


Pretty hard to misinterpret that comment.

Markets Drop at Close

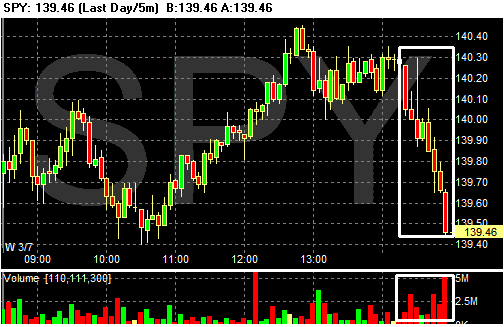
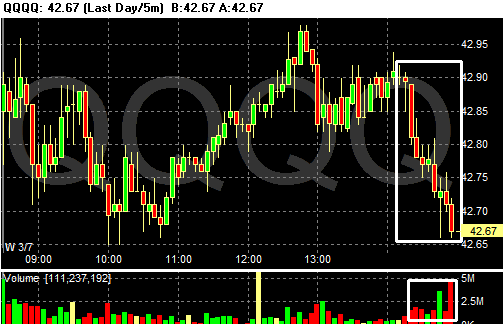
I've been posting the daily stock charts since the market sold-off last week. After a big sell-off, the daily charts can give us an idea of what traders are thinking about the market and let us know about the overall confidence level in the market.

Today we had a big sell-off in the SPYs and QQQQs at the end of the trading day. This indicates that traders don't want to hold positions overnight. This indicates a lack of confidence -- or at least a return of caution.

Photobucket - Video and Image Hosting

Photobucket - Video and Image Hosting

Photobucket - Video and Image Hosting

Oil Inventories Drop; Gas Prices Increase

From CBS Marketwatch:

Crude-oil futures climbed Wednesday to touch a high of $62 a barrel after U.S. data showed that supplies of crude declined for the first time in three weeks and distillate and gasoline inventories have been falling for several weeks.

"Import dynamics caused surprises in inventory changes," said Jason Schenker, an economist at Wachovia Corp.

"Lower crude and gasoline imports engendered a surprise draw in crude inventories and a larger-than-expected gasoline draw," he said an in e-mailed note to clients. And "the distillate inventory draw was mitigated by increased imports."

Crude for April delivery was last up $1.16 at $61.85 a barrel on the New York Mercantile Exchange, following a climb to as high as $62.


Looking at the charts from This Week In Petroleum, we see that gas inventories have been dropping for the last few weeks while the oil inventory just dropped this week.

Here's another chart of interest -- gas prices:

Photobucket - Video and Image Hosting

They've been ticking up lately.

Great New Webpage

I've always like Briefing.com. The link just listed is to a new page that keeps a running tab on up/down volume etc... by the hour. It's a really good page and I'm surprised it took somebody this long to do this.

Homebuilders See Tough Year

From Bloomberg:

A year after the housing slump began, the spring selling season is off to a rocky start with a glut of unsold properties and buyers like the Binghams putting off purchases, thwarting any chance of a recovery. The National Association of Home Builders in Washington now expects sales to fall for the sixth consecutive quarter after last month predicting a gain. The biggest stock market rout in four years last week, a jump in subprime mortgage failures and concerns about a possible recession are keeping consumers on edge.

....

Builders are bracing for another tough year after seeing 2006 sales plunge 17 percent, the most since 1990. For some, such as Toll Brothers Inc., the largest U.S. builder of luxury homes, the lackluster spring market is a surprise. Chairman and Chief Executive Officer Robert Toll told investors three months ago the market may be poised to rebound. It didn't happen.

``We're all a little more disappointed than we were two weeks ago,'' Toll said Feb. 22 on a conference call, responding to questions about February sales. ``We didn't have anywhere near the bump up that we usually see.''

The same day, Horsham, Pennsylvania-based Toll Brothers cut the number of homes it expects to build to 6,000 to 7,000, the second reduction in four months. In August, the company's estimate was 7,000 to 8,000 homes. Toll Brothers also lowered its fiscal year profit outlook on Feb. 22.

Miami-based Lennar Corp., the biggest U.S. builder by revenue, expects new home deliveries to tumble 20 percent this year. Hovnanian Enterprises Inc. of Red Bank, New Jersey, the industry's sixth-largest company, reported a fiscal first-quarter loss after the number of contracts signed slid 23 percent.


We're seeing some very large drops -- 20%+ and 1000 less homes indicates demand is waning. In addition, we still have a ton of inventory on the market at current demand levels that will take awhile to work off.

I thought housing was going to lead the US into recession by the current quarter. However, as the industry still languishes I think the blog Calculated Risk had it right: we're going to see lots of little cuts emerge in the US economy over the coming months. Expect to see declining construction employment, lower mortgage equity withdrawal numbers and lower home construction impacting overall GDP growth.

So far housing's problems have remained in the housing market. Only time will tell if that lasts.

Oil Market Update

The following paragraph about the oil market caught my eye:

"There is an expectation that when the equity markets complete the current correction, oil will resume its upward trajectory to test the 65 usd level," noted Harris.


Here's the daily chart of oil:

Photobucket - Video and Image Hosting

Notice that despite the sell-off this week, the market is still in an uptrend. Because we're close to the current trend-line, this week's action is pretty important from a technical perspective.

However, there are strong fundamental reasons for oil to increase. Once again, remember that we have India and China growing. So long as these economies are making large GDP advances there will be upward pressure on commodity prices. We're also entering the summer driving season in the US, adding further upward pressure.

Mortgage Risk Premiums Increasing

From the WSJ:

Turmoil in the market for bonds backed by home mortgages is starting to infect its commercial cousins: mortgage bonds backed by office towers, hotels and shopping malls.

The cost of insuring commercial-mortgage-backed securities as measured by an index known as the CMBX has jumped since late last month. The spread on the index that tracks riskier, BBB-minus-rated bonds has doubled to 1.64 percentage points this week from 0.84 percentage point on Feb 23, according to Markit Group, which administers the index.

"Moves of this magnitude and speed are uncommon in the unusually calm CMBS markets," noted analysts from Lehman Brothers in a report this week.


Mortgages are eventually pooled with other mortgages of similar maturity and interest rate and sold to investors. This process is done for all mortgage products. The commercial mortgage backed market is usually considered more secure because businesses are considered more stable than households.

If this market is seeing an increase in its risk premium, other markets must be. That means the cost of issuing and packaging mortgages has gotten more expensive.

Tuesday, March 6, 2007

Court Dates Tomorrow

In my real life (not my super-secret econo-geek super-hero life) I'm a trial lawyer. I'll be in court for most of tomorrow.

I'll be up early to check the headlines for what's interesting, but probably won't be back online until mid-afternoon CST (I live in Houston). Hopefully I'll be back in time for the market close to see how the markets perform.

BD

Markets Bounce Back

It looks like the bleeding has stopped -- at least for now. The markets rallied today. The SPYs were up 1.79%, the QQQQs were up 1.71% and the IWNs were up 2.74%. Below are the charts in the previously mentioned order. Notice the markets rallied well all day. They sold off a touch at the end, but that is to be expected. What's important going forward is traders are willing to hold their positions overnight.

I should add, this sure feels like a dead-cat bounce to me. The news today was uniformly bad -- productivity was down, new orders dropped and employment costs rose. This means

1.) Businesses will have a harder time passing on increased input prices.

2.) The economy is slowing, and

3.) Inflationary pressures may be increasing, or at the least holding steady.

All three together are very bearish news, adding further evidence that today's rally was mostly technical in nature.

Photobucket - Video and Image Hosting

Photobucket - Video and Image Hosting

Photobucket - Video and Image Hosting

Productivity Down, Labor Costs Up

From CBS Marketwatch:

The U.S. economy appears less productive and more inflation-prone than suspected.

Productivity of the U.S. nonfarm business sector rose at a 1.6% annual rate in the fourth quarter, weaker than the 3.0% pace estimated a month ago. Read full government report.

Unit labor costs -- a gauge of wage push inflationary pressures - were revised higher to a 6.6% annualized gain from a 1.7% increase.
Unit labor costs are the costs paid to workers to produce one "unit" of output. This is the largest quarterly gain since the first three months of 2006.

Unit labor costs have increased 3.2% in the past year, the fastest pace since 2000.


From Bloomberg:

U.S. workers were less productive last quarter than initially estimated and labor costs jumped, making it harder for the Federal Reserve to reduce interest rates even as manufacturing and housing continue to slump.

Productivity, a measure of how much an employee produces for each hour of work, rose at an annual rate of 1.6 percent, down from the 3 percent pace reported last month, the Labor Department said today in Washington. Labor costs climbed 6.6 percent, reflecting a one-time increase in bonuses. Separately, the Commerce Department said factory orders fell in January by the most in more than six years.

The figures mean inflation may be slow to dissipate even though economic growth is tailing off, creating headaches for Fed Chairman Ben S. Bernanke as concerns about a possible 2007 recession mount. Housing, whose slump triggered the slowdown in growth, so far shows few signs of bouncing back: A report from the National Association of Realtors today showed fewer Americans signing contracts to buy previously owned homes.


This is terrible news -- on a terrible news day.

There has been a fair amount of speculation about when the Fed would lower rates. This news hems the Fed in a heck of a lot more. Lower productivity means businesses are less able to absorb inflationary pressures (rising input prices). That means they will pass increasing costs onto consumers.

The higher labor costs -- even if it is a one time affair -- add to inflationary pressures as well. The one-time factor may help to limit this effect, but the number will still probably get some notice.

Factory Orders Drop Big

From the Census Bureau


New orders for manufactured goods in January, down following two consecutive monthly increases, decreased $22.9 billion or 5.6 percent to $383.1 billion, the U.S. Census Bureau reported today. This followed a 2.6 percent December increase.
Shipments, down following three consecutive monthly increases, decreased $4.6 billion or 1.2 percent to $391.2 billion. This followed a 1.3 percent December increase.

Unfilled orders, up twenty of the last twenty-one months, increased $0.6 billion or 0.1 percent to $695.2 billion. This was at the highest level since the series was first stated on a NAICS basis in 1992 and followed a 2.3 percent December increase. The unfilled orders-to-shipments ratio was 4.78, up from 4.71 in December. Inventories, down following ten consecutive monthly increases, decreased $0.9 billion or 0.2 percent to $482.0 billion. This followed a 0.2 percent December increase. The inventories-to-shipments ratio was 1.23, up from 1.22 in December.


Let's break this number down.

The following numbers are the seasonally-adjusted numbers.

The overall new orders number was down 7.8%. But Boeing transportation orders can make this number incredibly noisy. However, even without transportation orders, this number was still down 3.1%.

The 9.6% drop in unfilled manufacturing orders indicates back-orders are getting cleared out. That makes the drop in new orders that much more important as it appears manufacturers are clearing out their old orders and will have fewer orders going forward.

There was a 9.3% drop in new machinery orders and a 7.8% drop in new computer and electronic products orders. This means that capital spending plans may be dropping in the business sector.

Here's how Bloomberg reported the number:

Orders placed with U.S. factories declined by the most in more than six years in January on lower demand for aircraft, computers and construction machinery.

Factory orders fell 5.6 percent after a 2.6 percent increase in December that was larger than previously reported, the Commerce Department said today in Washington. Excluding transportation equipment such as Boeing Co. jets, bookings fell 2.9 percent, the biggest decline since September.

Business spending on new equipment fell by the most in more than five years as declines in the auto and construction industries took a toll on manufacturing. Weaker corporate investment, together with continued efforts to reduce bloated stockpiles, are likely to be a drag on growth this quarter, economists said.

``Manufacturing had a tough January as the inventory adjustment grinds on,'' said Joshua Shapiro, chief U.S. economist at Maria Fiorini Ramirez Inc. in New York. ``Capital spending is off to a weak start in the first quarter.''

GM -- $1 Billion in Bad Mortgages

From Bloomberg:

General Motors Corp., the world's largest automaker, may take a charge of almost $1 billion to cover bad mortgage loans made by its former home-lending unit, according to a Lehman Brothers Holdings Inc. analyst.

Residential Capital LLC relies on loans to people with poor or limited credit records or high debt burdens, for more than three-quarters, or $57 billion, of its loan portfolio, Lehman analyst Brian Johnson wrote in a research report. Delinquency rates on such subprime loans made last year are at a record high.


Continuing...

About 13 percent of the subprime loans backing bonds issued in 2006 and rated by S&P are delinquent, with 6.65 percent of the loans behind in payments by 90 days or more, according to Standard & Poor's. More than 20 lenders have closed or are seeking buyers since the beginning of 2006. Subprime mortgages typically have rates at least two or three percentage points above safer prime loans.

``Some traders are expressing their view that we're a pure mortgage market play, whether that's appropriate or not,'' Louise Herrle, ResCap's treasurer, said in an interview last week.


The sub-prime story is beginning to filter into the broader market. I seriously doubt this will be the last event in this area.

Commodoties Take Hit

From the Financial Times:

The recent volatility in global financial markets hit the commodities sector hard on Monday, as hedge funds and other investors scurried to reduce their risky investments.

Nickel prices tumbled 5 per cent, while copper and zinc fell almost 3 per cent and gold prices traded at levels more than 7 per cent lower than before the start of last week’s market turmoil.

This repositioning is prompting some unusual price swings and heavy trading flows, particularly in sectors that have been the focus of risk-taking over the past year, such as credit derivatives, emerging markets and commodities.

“I don’t think anything has fundamentally changed for commodity markets. I think it is just a case of investors selling their holdings to pay for losses they may have incurred elsewhere,” said Kevin Norrish, commodities analyst at Barclays Capital.

An adviser to a London-based fund of hedge funds added: “The big theme of the moment is deleveraging and derisking.”


Over the last month or so I have written a few articles about a possible summer rally in commodities. See here and here. Both of these articles relied on technical analysis.

It's easy to sell TA as a "holy grail" of investing. This is the way it was sold when I first started reading about it in the late 1980s/early 1990s. However, I would strongly encourage readers to look at the writings of Gann, Gartley and Schabacker. All three wrote in the 1930s era and all of their writing provides the baisc underpinnings of modern TA theory.

All three also make the following paraphrased observation: the markets will make an ass of you whenever and wherever they can. And they are very good at making an ass of you, so don't get cocky.

This week's market action clearly highlights technical analysis' shortcomings. By relying solely on chart patterns without any fundamental knowledge of the markets a trader can get killed.

I think the following paragraph from the above article still makes sense:

“I don’t think anything has fundamentally changed for commodity markets. I think it is just a case of investors selling their holdings to pay for losses they may have incurred elsewhere,” said Kevin Norrish, commodities analyst at Barclays Capital.


India and China are still growing. That's a little under 2 billion people who are living in economies growing at 8% or more. They want stuff. As I wrote in one of the articles:

Remember we still have China and India on-line for very strong growth rates, increasing demand for base metals.


Fundamental analysis tells you what to buy.

TA tells you when to buy.


I will caution: it can all change tomorrow.

Subprime Problems In Graph Form

This chart is from the WSJ:

Photobucket - Video and Image Hosting

Notice a few things.

1.) Defaults now are higher than they were in 2002-2003 at the beginning of this expansion.

3.) '02-'03 were the first two full years of this expansion.

That means sub-prime mortgage delinquencies are higher now -- 6 years into the expansion -- than they were at the beginning of the expansion.

A simple explanation may be delinquency rates were coming down in 20-03. This is possible. However, the fact we are six years into an expansion and delinquency rates are this high may indicate other problems -- such as the effect of lending money to everybody who has a pulse.

Monday, March 5, 2007

Homebuilders Rally Looks Over

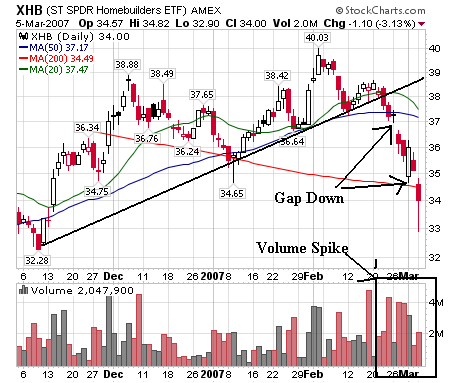
The homebuilders stocks enjoyed a rebound that traced back to the beginning of the recent stock rally. However, that rally looks over at this point.

Here's the daily chart

Photobucket - Video and Image Hosting

Notice we have two gaps down with a large volume on the sell-off.

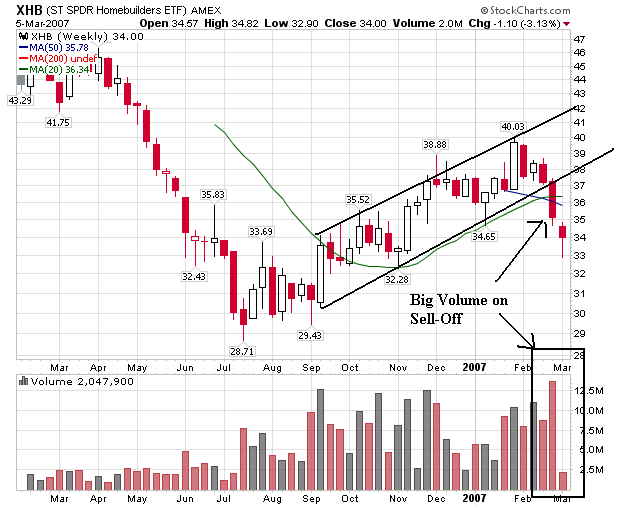
Here's the weekly chart:

Photobucket - Video and Image Hosting

This chart more clearly shows the drop-off that's occurred. Notice the uptrend is clearly broken.

Sub Prime Blues Continue

From Yahoo News:

Fremont General Corp. intends to exit its sub-prime residential real estate lending operations, the company said Friday.

The move was prompted by a Proposed Cease and Desist Order Fremont General received from the Federal Deposit Insurance Corp. on Feb. 27 that calls for the company to make a variety of changes to restrict the level of lending in its sub-prime residential mortgage business, among other things.


The use of the phrase "cease and desist" sounds like some type of illegal event was happening. In reality, this is the FDIC saying, "you need to stop doing business in this manner."

Markets Drop; Charts Look Terrible

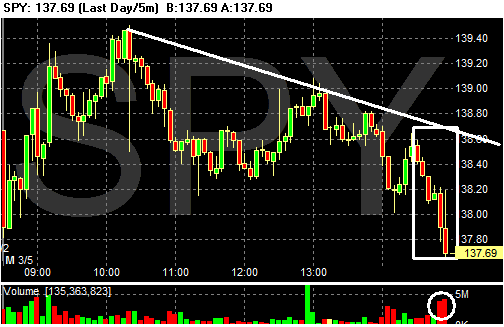
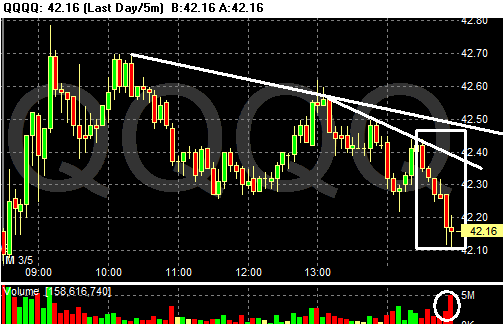
The markets are closed. The SPYs lost .9% the QQQQs lost .97% and the IWNs lost 2.12%. Clearly people are getting out of small caps.

With the charts below, notice

1.) All the markets had a downward bias

2.) Traders dumped stock at the end of the day, indicating a lack of confidence about the overnight situation

3.) The increased volume at the end of the day.

Photobucket - Video and Image Hosting

Photobucket - Video and Image Hosting

Photobucket - Video and Image Hosting

ISM Decreases But Still Expansive

From the ISM:

"Non-manufacturing business activity increased for the 47th consecutive month in February," Nieves said. He added, "Business Activity and New Orders increased at a slower rate in February than in January. Employment increased at a faster rate than in January. The Prices Index decreased 1.4 percentage points this month to 53.8 percent. Nine non-manufacturing industries reported increased activity in February. Members' comments in February are mixed concerning current business conditions. The overall indication in February is continued economic growth in the non-manufacturing sector, but at a slower pace than in January."


Overall business activity decreased, but any reading above 50 is considered a sign of expansion.

New orders and the backlog of orders decreased slightly, but far from an alarming rate. The decrease could be accounted for as pure statistical noise.

New export orders increased faster than new import orders. While the US still has an incredibly long way to go until it deals with the trade imbalance, any possible sign of improvement is a good thing.

Markets Open Lower

As of this writing, the markets gapped down on the open.

Hang on -- it's going to be another bumpy week.

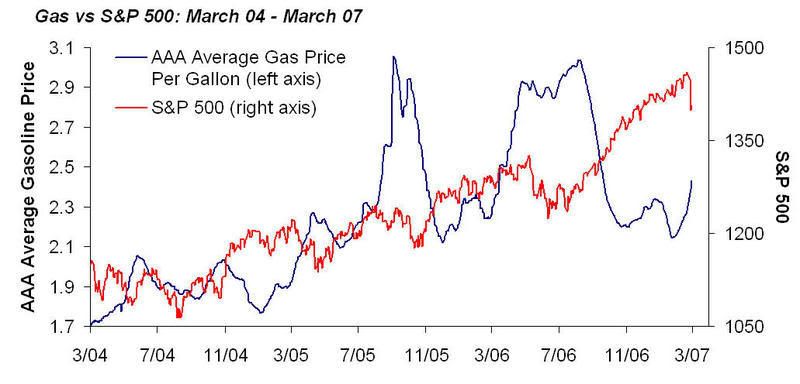
Gas and the S&P

This chart is from TickerSense -- one of my favorite econ/market blogs. Notice the inverse relationship between gas prices and the S&P 500 for the last year or so.

Photobucket - Video and Image Hosting

How Fast Will the Carry Trade Go Away?

From Seeking Alpha:

Japan's Ministry of Finance reports Q4 (ended Dec.) capital spending increased 16.8%, beating the prior quarter's reading of 12.0% and analysts' estimates of 13.0% to 14.2% (Reuters). Up to a 1.0% revision to Q4 GDP is expected. Jesper Koll, chief economist at Merrill Lynch Japan, says annualized Q4 GDP will be revised to 5.1% from 4.8%, adding that "It is a trigger point for the Bank of Japan to normalize interest rates a little more aggressively." Bloomberg quotes Koll who also says, "The crisis of the 1990s is definitely over. Japan is in the process of building a strong platform for very strong, competitive economic growth." An economist at Nikko Citigroup however, says a revised GDP is not necessarily good due to concerns over rising inventories which "may prompt adjustments in production in coming months." The yen rose 1.7% today to ¥115.6/$1 as of the market's close in Tokyo. Japanese stocks meanwhile fell for a fifth straight day, as the Nikkei 225 lost 3.3% to 16,642.


The difference between Japanese and US interest rates is still large -- to the tune of 500+ basis points. However, even the hint of the carry trade (borrowing in Japan and lending in the US) going away has serious implications for the US and Japanese markets.

Asian and European Stocks Tank

From the WSJ:

Asian stocks dropped sharply across the region, with Japanese shares declining for the fifth session in a row, while Hong Kong retreated 4%.

Japan's Nikkei 225 Index fell 3.34% to 16642.25, extending a slide for a fifth day that was sparked by last week's plunge in Chinese and U.S. stock markets. Exporters were hit hardest on the yen's recent rally. Since climbing to its highest in nearly seven years last Monday, the index has slid 1573.10 points, or 8.64%, over the last five trading sessions.


The rest of the region and Europe was just as ugly.

Markets in Hong Kong, Australia, the Philippines, Malaysia, India and South Korea all fell sharply Monday, continuing their declines from last week, when a 9 percent plunge in Chinese stocks on Tuesday triggered cascading selloffs on Wall Street and other global markets.

European markets also opened lower Monday, with Britain's benchmark FTSE 100 down 1.5 percent in early trading, France's CAC 40 sliding 1.8 percent and Germany's DAX sinking 2.1 percent.


It's going to be a bumpy week.

HSBC's Yearly Bad Debt Coverage Increases 36%

From the WSJ:

HSBC Holdings PLC, reporting its 2006 results, said the cost to cover bad debts soared 36% to $10.57 billion in 2006 because of the bank's ill-fated move to buy risky subprime loans from U.S. originators.

Overall, the London bank said net income rose 4.7% to $15.79 billion in 2006 from $15.08 billion. HSBC is the world's third-largest bank ranked by market value behind Citigroup Inc. and Bank of America Corp.

In 2005 and 2006, HSBC's U.S. business, HSBC Finance Corp., increased the number of subprime mortgage loans it bought from originators. But amid increasing interest rates and slowing housing price appreciation, borrowers defaulted at record rates, including in 2006 where loans were just months old. Last month, the bank replaced the top management of its U.S. operations and acknowledged that it had made mistakes in its mortgage strategy.


This isn't going to be the last we hear about this, from HSBC or any other bank that has subprime exposure. This story is going to last awhile.

Sunday, March 4, 2007

The Long-Term Perspective

Here is a 5-year chart of the SPYs, QQQQs and IWNs in a weekly format. Notice three things.
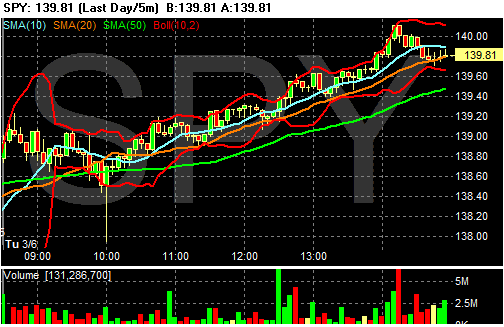
1.) We are still in an uptrend.

2.) Just eyeballing the charts, we would have to move at least 5% more to the downside before we moved into secular bear market territory.

3.) Volume really spiked last week. That could indicate the beginning of at least a short-term correction.

Photobucket - Video and Image Hosting

Photobucket - Video and Image Hosting

Photobucket - Video and Image Hosting

The Week Ahead

We have some important economic news coming out.
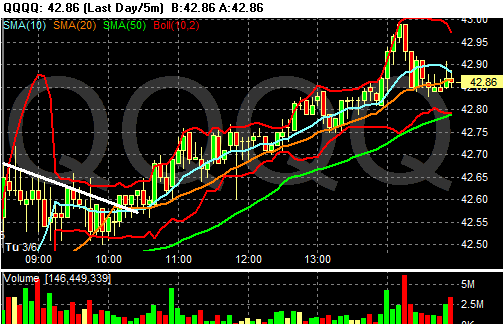
Monday we have the non-manufacturing ISM survey. This will give us a gauge of the service economy.
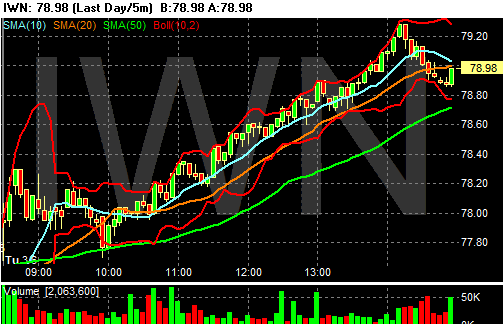
Tuesday we have factory orders, which will further clarify the durable goods number from last week. We also have productivity which will help to provide some guidance on the inflation number.

The Beige Book comes out on Wednesday. This is a great read for eco-nerds.

Friday is the big number: jobs. The economy has slowed for the last three quarters, so this figure will either confirm or deny that figure.

We also have markets in a technically bad place, so we should have a wild ride.

S&P Top 10 Stocks

Here is a list of the second set of top 5 stocks in the S&P 500. Collectively these stocks represent about 7.5% of the overall average. They are listed from the largest to smallest as a percentage of the average.

Photobucket - Video and Image Hosting

Photobucket - Video and Image Hosting

Photobucket - Video and Image Hosting

Photobucket - Video and Image Hosting

Photobucket - Video and Image Hosting

With the exception of AIG, all of these stocks are in clear downtrends. When you combine these charts with the top 5 S&P stocks you get a pretty dismal picture of the big S&P positions: 8 of the 10 largest caps in the index -- representing about 20% of the average -- are in downtrends. Citigroup is close to a downtrend and the only reason AIG is in an uptrend is an incredibly favorable special circumstance YOY earnings performance (Last year AIG's earnings were low because of a legal settlement).

The Week Ahead: Fundamentals v. Technicals

As I wrote below, the bear case going forward is based on negative fundamentals - subprime housing problems and slower economic growth. In contrast, the the bull case is almost purely technical, essentially arguing the market isn't cheap but not overly expensive right now. Up until now, bullish traders have also had strong technical reasons to stay glued to their charts irrespective of fundamental news. Now those charts are showing bearishness and possible technical reversals. I think it's going to be hard for them to maintain their bullishness going forward. In addition, I think they will pay more attention to bearish news going forward.

Food for thought.

Feds Issue Dub-Prime Guidance

From Yahoo Financial News:

Federal bank regulators, worried about a surge in defaults on high-risk home mortgages, called on lenders to exercise caution in making subprime loans and strictly evaluate borrowers' ability to repay them.

The proposed guidance issued Friday by the Federal Reserve and the other four federal agencies that regulate banks, thrifts and credit unions, comes in an increasingly troubled market for subprime mortgage loans. Home-mortgage delinquencies and foreclosures are spiking, especially for people who took out subprime mortgages -- higher-interest loans for those with blemished credit records or low incomes who are considered higher risk -- during the sizzling housing boom that waned in the second half of 2005.

The regulators said the guidelines, if formally adopted by the agencies and followed by lending institutions, could result in fewer borrowers qualifying for subprime loans. The mortgage industry had hoped for less stringent guidelines.

John Robbins, chairman of the Mortgage Bankers Association, said the group was concerned that the guidelines "may restrict credit to many consumers in high-cost areas and deny credit to many deserving low-income, minority and first-time home buyers."


Not to sound cold-blooded, but the MBA statement sounds like nothing more than a soundbite. 20% of the loans Countrywide services are delinquent; according to UBS 2006 vintage subprime loans are performing poorly right out of the gate.

This isn't about denying credit to worthy borrowers who need a break; it's about not issuing credit simply because someone has a pulse.

In addition, here's some really big news:

On Tuesday, Freddie Mac, the nation's second-largest financer of home loans, said it will stop buying those subprime mortgages that it deems most vulnerable to default or foreclosure.


Translation: liquidity is drying up -- big time.