Showing posts with label yield curve. Show all posts

Friday, July 20, 2007

Borrowers Are Sweetening Deals

From the WSJ:

Banks raising nearly $40 billion in buyout-related debt for Chrysler Group and the United Kingdom's Alliance Boots PLC are being forced to sweeten terms for investors and face delays in their sales, in another sign of turbulence in global debt markets.

Chrysler is being taken over by Cerberus Capital Management, a New York hedge fund, and is raising $20 billion in loans as it separates from DaimlerChrysler AG. Alliance Boots, a chain of U.K. drug stores and a wholesale pharmaceutical-distribution firm, is being taken over by Kohlberg Kravis Roberts & Co. and is raising the U.S. dollar equivalent of $18.4 billion.

In both cases, bankers are shopping interest payments to investors that are around a half percentage point more than originally planned. And in both cases, they're putting off plans to close the deals in the next few days. The Alliance fund raising might be delayed by months, people familiar with the situation said. The Chrysler debt sale is expected to close next week.


This is far from the end of the world for the M&A market. Credit terms have been incredibly lax for the last few years. A better description of events would be a "return to prudent lending standards".

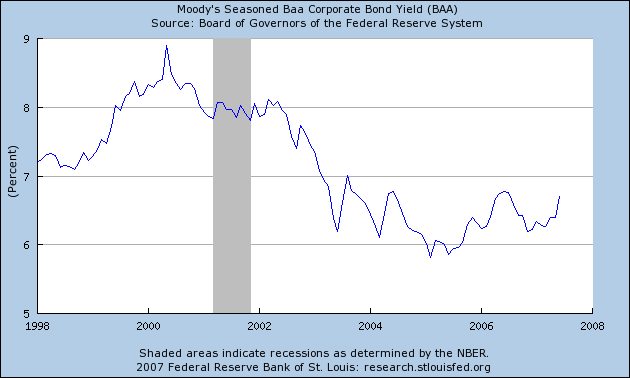
As an example, here is a chart of the daily baa yield for the last 10 years. While rates have increased, they are still below the levels at the end of the 1990s.

Photo Sharing and Video Hosting at Photobucket

Monday, March 12, 2007

Yield Curve Says Recession -- Still

From Bloomberg:

The probability the U.S. economy will shrink for two quarters has risen to 50 percent, according to a model created when Greenspan ran the Board of Governors of the Federal Reserve System. The formula is based on differences in yields on Treasuries.

The economy has gone into recession six of the seven times since 1960 that short-term interest rates topped longer-term bond yields, as they do now. The difference between three-month bills and benchmark 10-year notes is close to the widest since 2001. Investors say the so-called inverted yield curve is a sign the Fed will cut borrowing costs because the economy is decelerating.


Here is something that I haven't written about in awhile -- the inverted yield curve. Short-term rates have responded to the Fed's interest rate hikes while the long-term part of the curve thinks inflation is at least in check for now. That means market participants think the economy is slowing and possibly moving into a recession.

The argument can be made that long-term rates are in fact responding to foreign direct investment in the US. However, this argument forgets to acknowledge that these investors wouldn't invest in US debt if inflation was an issue.

The short version is the yield curve is inverted, has been for some time and that is usually a sign of an approaching recession.

Thursday, March 1, 2007

Tightening Credit Spreads. Is This a Good Thing?

This is from today's WSJ:

Photobucket - Video and Image Hosting

Credit risk is usually measured against a baseline interest rate. For example, the US Treasury market is considered the safest fixed-income investment. Therefore, the yield of other fixed income investments is compared to US Treasuries. The difference between the yields is called the spread, and it is measure of the amount of risk in the markets.

Notice how high-yield US corporates (junk bonds) were trading about 500 basis points above US Treasuries at the end of the last expansion in 2000. Now that spread is far less. This indicates investors are far more willing to buy higher-yielding junk debt. Now, it's important to remember default rates on high-yield debt are at very low levels right now, so investors may be making a prudent decision. However, this tightening of spreads indicates people are far more comfortable with higher-risk assets.

This in turn makes borrowing far cheaper for higher-risk entities. Compare the 2000 interest rates of roughly 12% with the roughly 8% currently. That's 4% or 400 basis points cheaper. Companies with poorer credit can get very cheap financing right now. If investors start to shy away from risk, the cost of credit will increase, making borrowing more expensive, which in turn slows business expansion.

The exact same arguments could be made for developing countries debt which are also on the graph.

Thursday, February 8, 2007

Yield Curve Inversion Continues

From Caroline Baum of Bloomberg:

Depending on what measure of short- and long-term rates one uses, the slope has been negative for either six months (using the 3-month Treasury bill and 10-year note) or seven months (using the federal funds rate and 10-year Treasury note). A yield curve that slopes upward, with long rates higher than short ones, encourages financial institutions to borrow short, lend long and pocket the difference, promoting economic growth in the process.

An inverted yield curve has been a harbinger of recession in the past. Unless this time is different -- a popular way of dismissing the spread's stellar history -- real gross domestic product growth of 3.5 percent in the fourth quarter may turn out to be the outlier, not the trend.


This is a really long time for an inversion to continue. And it begs the question, "is this inversion different than past inversions?" After all, 4th quarter GDP came in at 3.5%, and unemployment is low, indicating a recession isn't on the horizon yet. Or it's been averted for awhile.

I don't have an answer for the above statements. What I think is the "this time is different" argument does not play well with historical evidence. As Baum also notes this indicator is not the "hemline indicator". There's a fundamental reason for the inversion. And until the inversion goes away, we should pay attention to the yield curve.