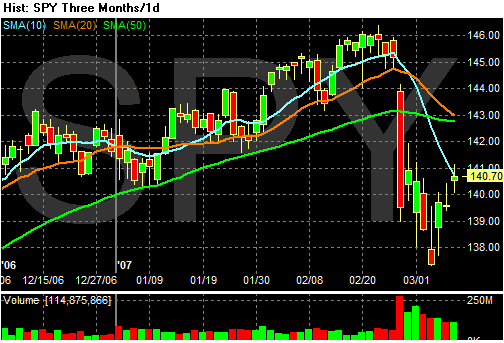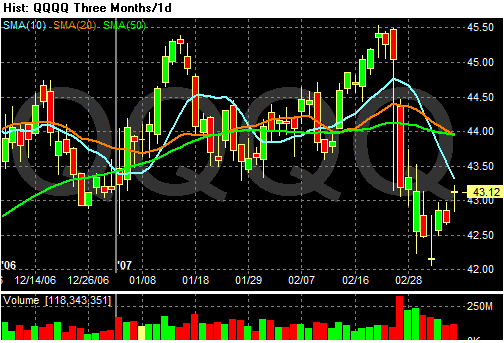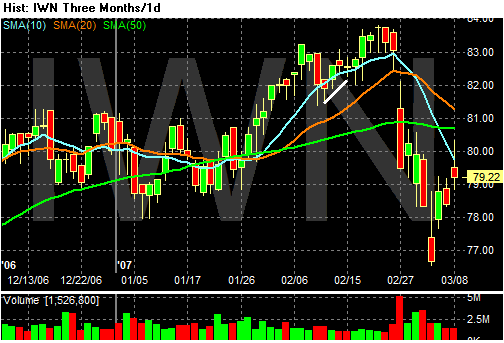


We had the big down day, followed be a slightly less pronounced decline. All three charts have a classic candlestick hammer style bottom. While we had a relief rally over the last few sessions, notice it's been on declining volume. In addition, the candle bars of the rally are weak -- the open and closes are very close. All of these factors can signal the rally is losing steam and traders are looking for a reason to sell. In addition, all three averages are approaching their respective 10-day moving averages, which could be a resistance line for all three.
Again, this is not set in stone. We're simply trying to play the averages about what could happen.