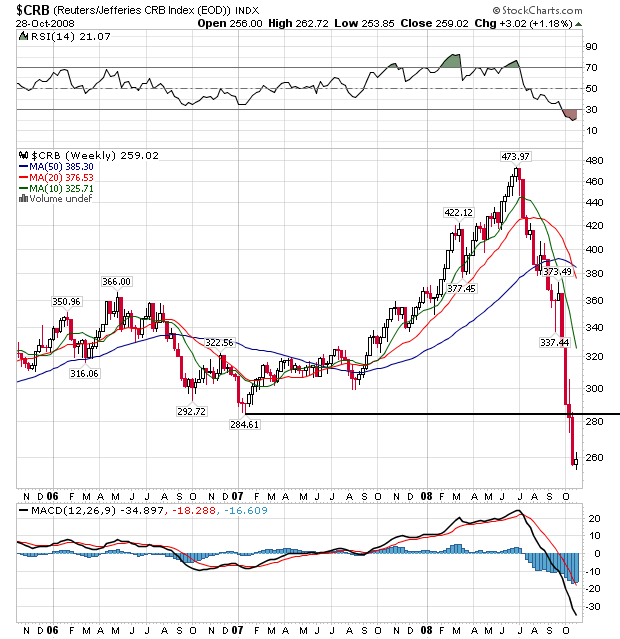
On the weekly chart notice the following:
-- Prices are at or near their lowest level in three years
-- Prices have dropped 45.24% since their early July high
-- The 10 and 20 week SMA have moved through the 50 week SMA
-- Prices are below all the SMAs
-- The only bullish point to make is the average is technically oversold
Bottom line: this is a bearish chart.
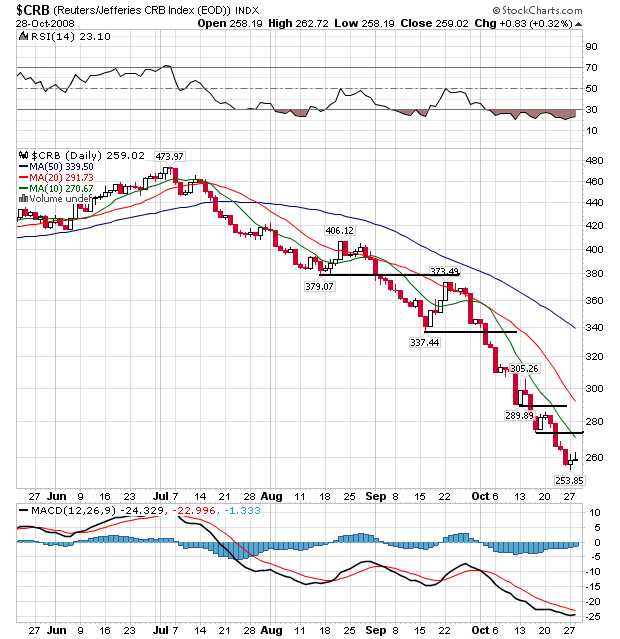
On the daily chart notice the following:
-- Prices are below all the SMAs
-- Prices have continually moved through previously established support levels
-- All the SMAs are moving lower
-- The shorter SMAs are below the longer SMAs
-- The only bullish point to make is the average is technically oversold
Bottom line: This is also a very bearish chart.