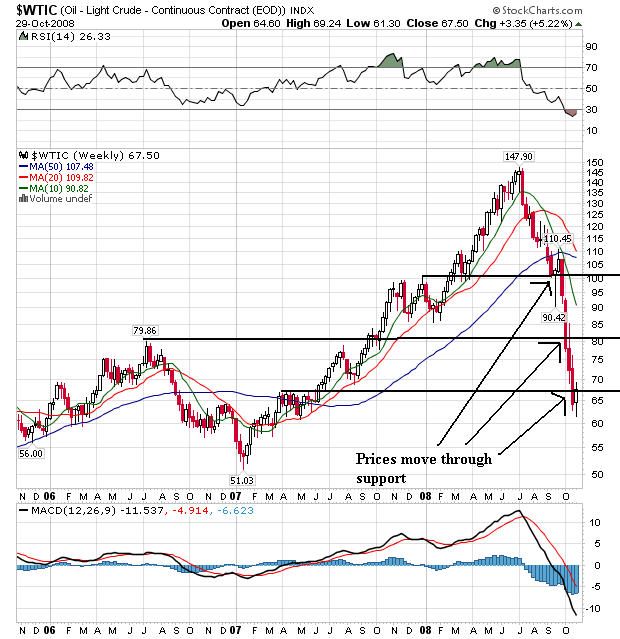
On the weekly chart, note the following:
-- Price have continually moved through support levels
-- The 10 week SMA has moved through the 50 day SMA
-- The 20 week SMA is about to move through the 50 day SMA
-- The 50 week SMA is turning lower
-- Prices are below all the SMAs
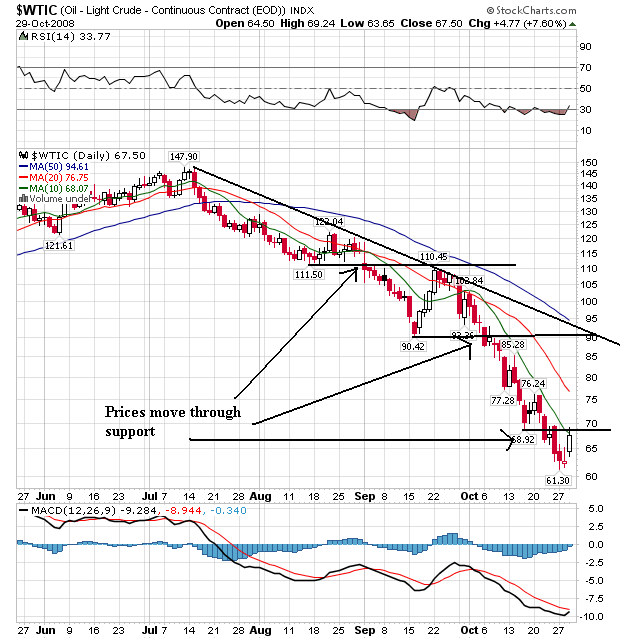
On the daily chart, notice the following:
-- Prices have been moving lower for three months
-- All the SMAs are moving lower
-- The shorter SMAs are below the longer SMAs
-- Prices are below all the SMAs
Bottom line: both of these charts are bearish. The only bullish element is the markets are technically oversold right now.