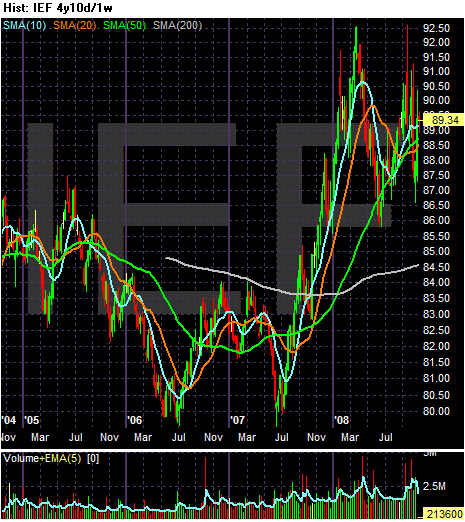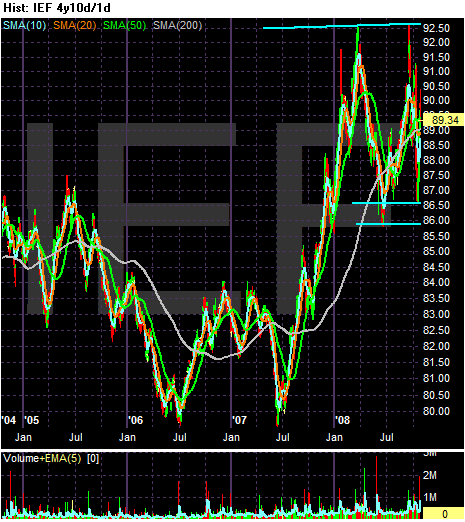
Note first the multi-year double bottom. The first bottom occurred in mid-2006 and the second occurred in mid-2007. In mid-2007 the market started an almost year-long rally caused by the credit crisis. Then the market sold-off because of a stock market rally, only to rally again.
Note that in 2008 we have a double top formation with the first rally ending at the end of 1Q 2008 and the second rally ending at the end of 3Q 2008. Also remember that on the other side of Treasuries' price is yield, which is inversely related to price. That means higher-price = lower yield. This means there is a limit to upward price appreciation of a bond because eventually the yield won't adequately compensate the purchaser. Given the higher pace of inflation this year I think it's fair to say we have probably reached the top of the price range for treasuries.
Assuming that we have seen the top treasury prices we have two possible moves.
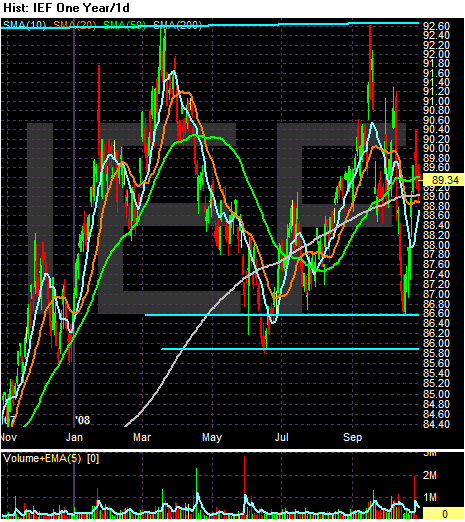
1.) Sideways: below are two charts -- the multi-year chart from above and a 1 year chart that use the same upper and lower lines of support and resistance. A sideways market means bull and bear forces are in equilibrium. On the bull side we have further problems in the stock market, the credit crisis and the flight to safety. On the bear side we have more treasury issuance from the increased US government funding needs and yields not being high enough to compensate investors for inflation.


2.) A sell-off: This would assume there is a viable alternate investment which would consistently draw funds from the Treasury market. Given the highly volatile nature of the stock market right now I don't see this happening.