Tuesday, June 17, 2008

What Inflation? Part II

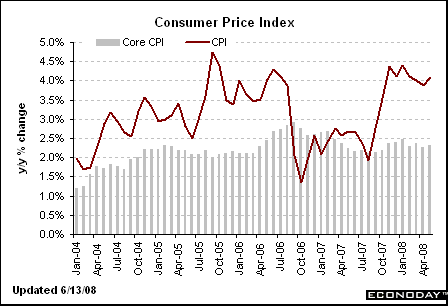
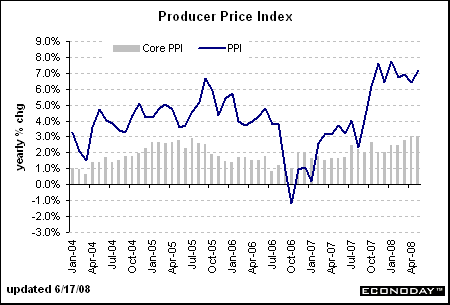
Here are two charts that show the year over year increase in CPI and PPI


Things aren't looking that good right now.

2 comments:

Anonymous said...

Is there somewhere I can bookmark a link for total Consumer Price Index, NOT minus fuel and food?

What is the reasoning behind stripping out those two important elements? They say it's volatility, but moving averages would solve that.

Is there a moving average chart available?

Anonymous said...

bls.gov has CPI and PPI numbers. What I am curious about is the PPI for finished goods and intermediate goods were tracking together and diverged at the beginning of 08. Now while finished goods are up 7.2 intermediate goods have increased 12.6% y-o-y. And Crude goods were up about 12% y-o-y last summer, have now spiked to 41.5% y-o-y. There seems to be a whole lot of PPI inflation coming.