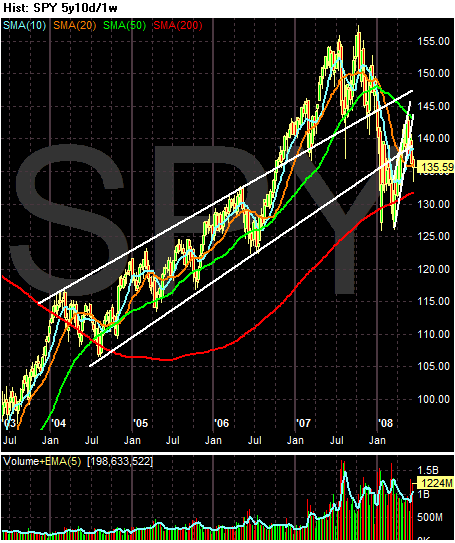
On the SPYs, notice the market rose in a nice channel from the beginning of 2004 until the end of 2006 when the market broke through upside resistance. The market continued rising until it formed a double top in 2007. Since then, the index has moved through both the upper and lower trend lines of the 2004 - 2007 channel. Prices have moved through the lower trend line going up and have now fallen through the line.
This tells us the overall bull market that started in 2004 is now officially over.

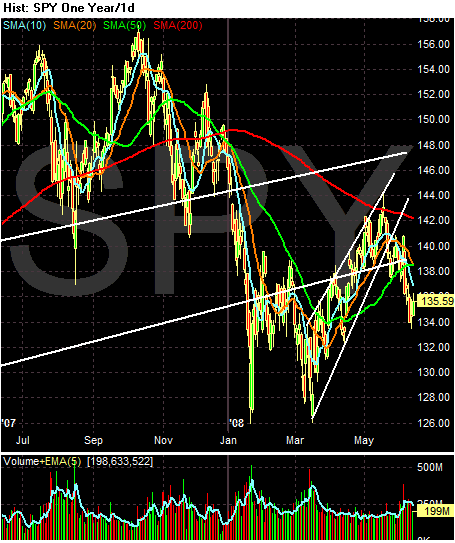
The one year chart provides a much closer look of the fall through the two trend lines. First, notice the double top with the first top in late July and the second top in October of 2007. Then notice how the average fell through the two trend lines from the 2004 - 2007 channel in early 2008. After the Fed back-stopped the JPM/Bear Stearns deal in mid-march the market rallied higher. But the 200 day SMA proved too much upside resistance for the average and prices have fallen back from those levels.

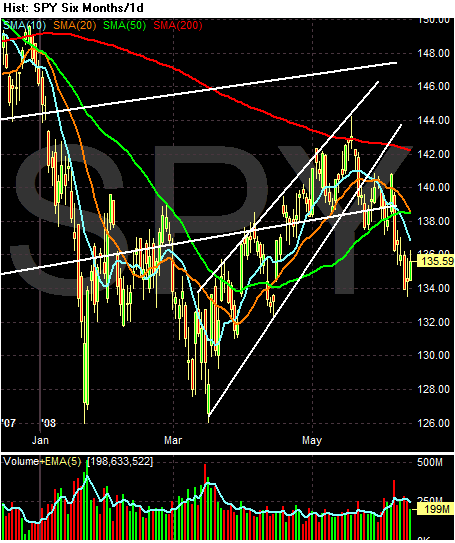
On the three month chart, notice the following:
-- Prices advanced to the 200 day SMA but since pulled back
-- The 10 day SMA has fallen through the 50 day SMA, and the 20 day SMA is about to fall through the 50 day SMA.
-- Prices are below all the SMAs
This chart is turning more and more bearish.

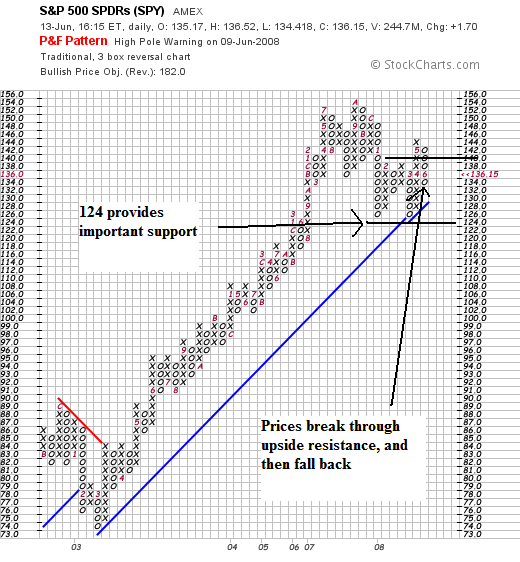
The P&F chart shows a few important points.
-- Notice with the latest rally prices moved through upside resistance, but then fell back down through important levels just as quickly.
-- The 124 level provides important support. Any move through there would signal a strong downside move was dead ahead.
The general conclusion get from this chart is the SPYs are heading lower.