On the five year chart, we can see a strong and very clear uptrend that started in mid-2004. The IWMs continued on this path until the end of 2007/beginning of 2008 when they fell through support.
On the one year chart, notice the clear downward trajectory of the chart.
On the three month chart, notice the following:
-- There are several upward sloping channels and trend lines, all of which the average has broken
-- Prices got beyond the 200 day SMA, but fell back quickly unable to maintain upward momentum
-- The 10 day SMA just turned lower and is about to cross below the 20 day SMA
-- Prices have fallen to the 50 day SMA which is the last possible technical support line from the SMAs
-- Prices are below three of the 4 major SMAs
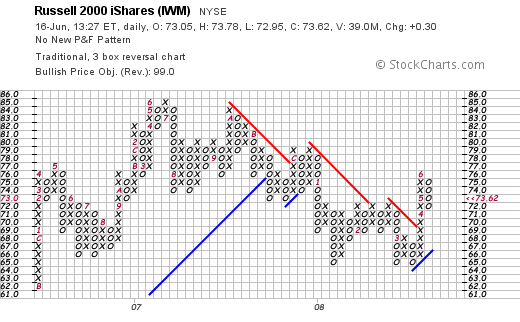
On the IWM P&F chart, notice the lower highs on the chart.
The bottom line is this chart is deteriorating, but it has not completely fallen apart yet.