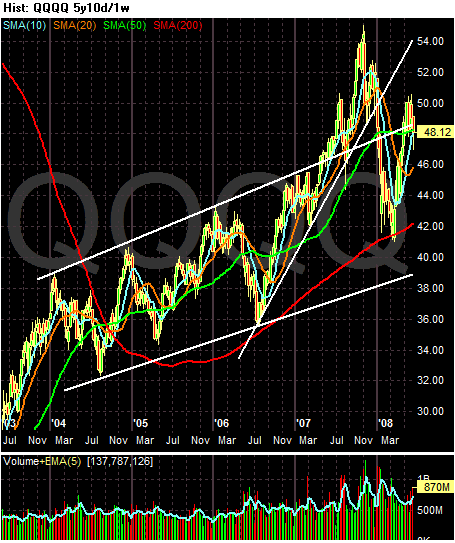
On the 5-year, weekly chart, notice there are two trends in place. The first started at the beginning of 2004 when the index formed an upward sloping channel. The second formed in the middle of 2006 when the index moved through the upper resistance channel line of the 2004 channel. Prices broke through the rally that started in 2006 at the end of 2007/beginning of 2008. Prices also moved through the upper trend line at the beginning of 2008. Prices have since rallied through and back down through this upper channel line.

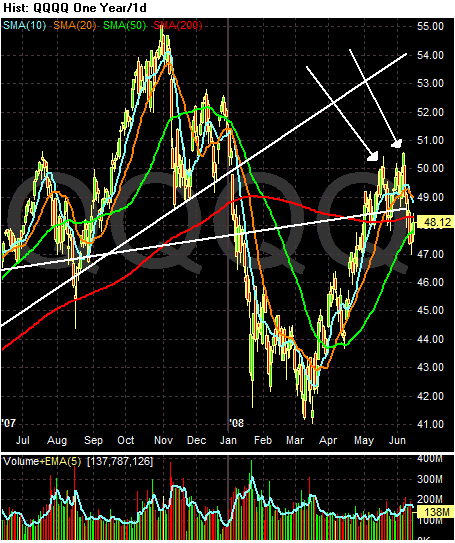
Above is a 1 year chart that shows the more recent action with a bit more clarity. Also notice the index formed a double top in mid-May and early June of 2008 and has since fallen from these levels.

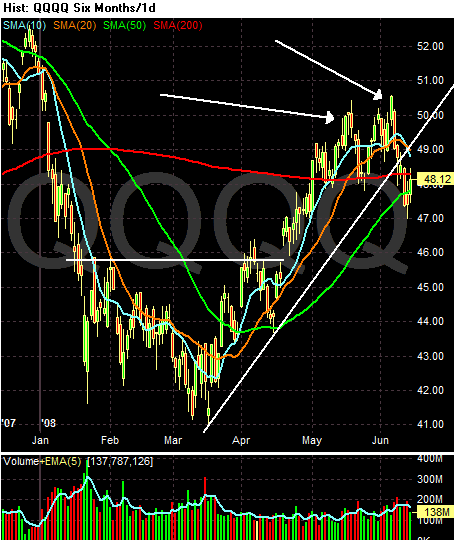
On the three month chart, notice the following:
--- The 10 and 20 day SMAs are above the 50 and 200 day SMA
-- The 10 and 20 day SMA have recently turned negative
-- Prices have moved through the 200 day SMA
-- Prices are using the 50 day SMA as technical support

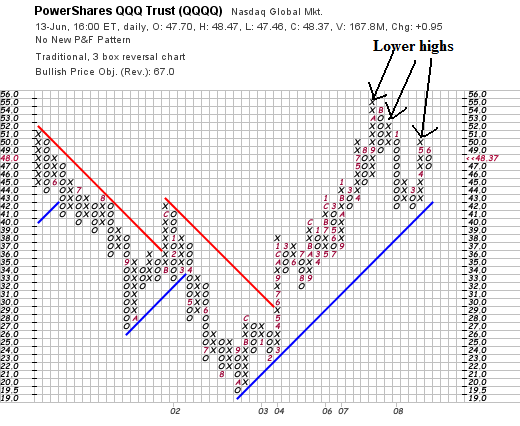
The main point the P&F chart shows us is the QQQQs have a series of declining highs.
The bottom line with these charts is they show a weakening sector. It's not a completely bearish chart, however. It's more lukewarm.