Flooding in the Midwest could mean drivers will be getting a bigger soaking at gasoline pumps nationwide.
In recent days, corn-based ethanol prices have risen along with floodwaters as commodities traders worry about damage to corn crops. Ethanol futures are up 17% over the past week, to $2.89 a gallon, mirroring the price of corn, which has risen 13% during the same period, according to Thomson Reuters.
Since refiners blend ethanol into gasoline, higher ethanol prices mean higher costs for refiners, which could be passed on at the pump as Americans enter the summer driving season.
"It's coming at the worst possible time," said Stephen Schork, editor of the Schork Report, a newsletter on energy.
Drivers already are paying record prices. The average price of gasoline cracked $4 a gallon for the first time earlier this month, and prices are up 36% from a year ago, according to the Energy Information Administration. (Please see related article on page A4.) Nonetheless, gasoline's rise hasn't been nearly as dramatic as crude oil's, which is up 94% over the past year.
.....
The bigger question is the long-term impact. The Iowa Farm Bureau estimates Iowa, usually the largest corn-producing state, has already lost up to 10% of its corn crop, and a study from Ball State University in Muncie, Ind., estimates total crop damage in the state could amount to $2.7 billion.
And from the WSJ:
Corn prices continue to climb on concerns about Midwestern flooding and crop damage but avoided taking out records.
Nearby July corn at the Chicago Board of Trade rose 9.75 cents to $7.4225 a bushel Tuesday. It had previously hit highs for eight straight days, most recently at $7.60 intraday on Monday.
The market shook off early assessments by some observers that a government report Monday showing 57% of the crop was rated good to excellent was bearish. That was down three percentage points from last week, but some traders expected a steeper drop, given the extent of the flooding, particularly in Iowa, the top corn-producing state.
But analysts said regardless of expectations, the report, from the Agriculture Department, paints a dire picture.
"This is the lowest-rated corn crop since 1996, the lowest-rated soybean crop since 1993," said Brian Hoops, president of Midwest Market Solutions. "That doesn't sound bearish."
From Bloomberg:
Soybeans for November delivery rose as much as 13.75 cents, or 0.9 percent, to $15.6675 a bushel and last traded at $15.5125. The price rallied 2 percent yesterday. Soybeans have gained 28 percent this year and reached a record $15.865 on March 3.
``The jet stream will help to steer severe storms on the western Plains away from the flooded Midwest. However, more rain could hit the flood zones on Thursday,'' said private forecaster AccuWeather.com in State College, Pennsylvania.
About 57 percent of the corn crop was in good or excellent condition as of June 15, down from 60 percent a week earlier and 70 percent a year ago, the U.S. Department of Agriculture said June 16 in a report. About 56 percent of soybeans got the top ratings, compared with 57 percent a week earlier and 65 percent a year ago, the agency said.
Considering corn and soybeans are grown in the Midwest, this news should not be surprising. In fact, it should be downright predictable.
Let's take a look at some charts to see how they play out.

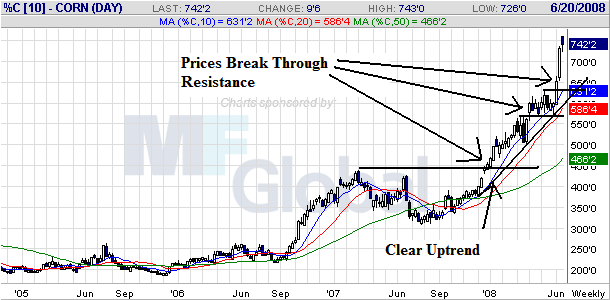
On corn's weekly chart, notice the following:
-- The chart is a classic up down up pattern. Prices rose from the end of 2006 to the middle of 2007. Then they consolidated from mid-2007 to the beginning of 2008. Since then they have been in a clear rally, breaking though upside resistance on several occassions.
-- Also note the very bullish alignment of all three SMAs. The shorter are above the longer, all three are moving higher and prices are above all the SMAs.

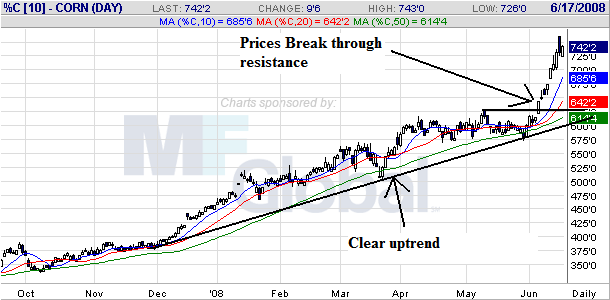
On the daily chart notice the following:
-- Prices have been in a clear uptrend since the end of last year.
-- All the SMA are moving higher
-- The shorter SMAs are above the longer SMAs
-- Prices are above all the SMAs
-- Prices have broken through upside resistance on several occassions
This is a very bullish chart.

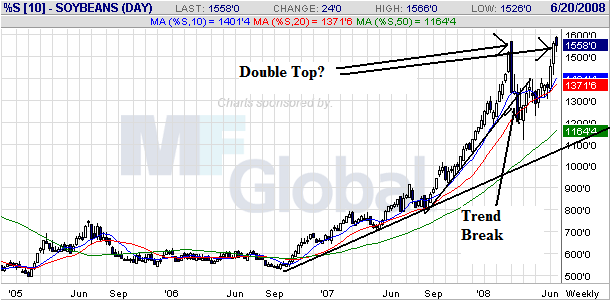
On soy beans weekly chart, notice the possible double top forming right now. That means the recent price spike could be nothing more than a temporary development.

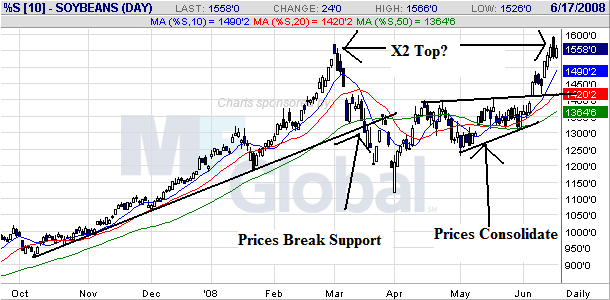
On the daily chart, notice the following:
-- Prices formed their first top at the end of March. Since then then fell through support, consolidated in a triangle pattern and have since risen to a high near the previous high in late March.
-- While prices and the SMAs have formed a very bullish pattern, the fact we're looking at a double top takes some of the upside excitement away from this chart.