Let's go to the charts.
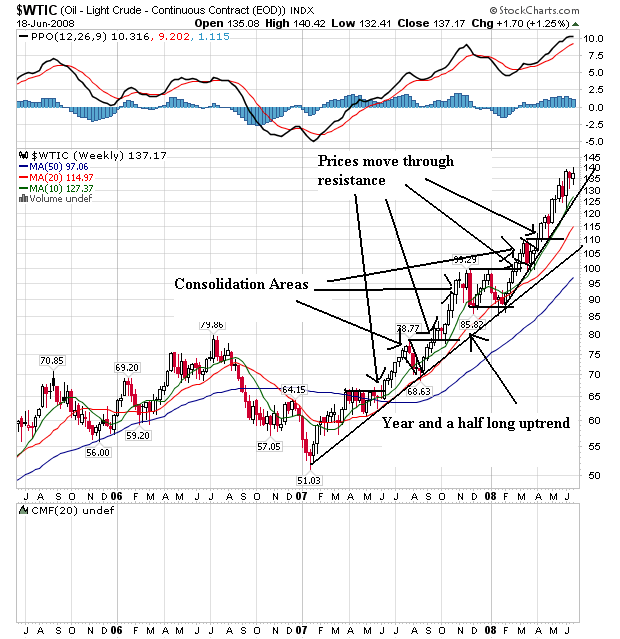
Oil prices have been rallying since the beginning of 2007. They have continually moved through upside resistance and consolidated gains. In addition, the price/SMA alignment is the most bullish possible. Prices are above all the SMAs. The shorter SMAs are above the longer SMAs. All the SMAs are moving higher.
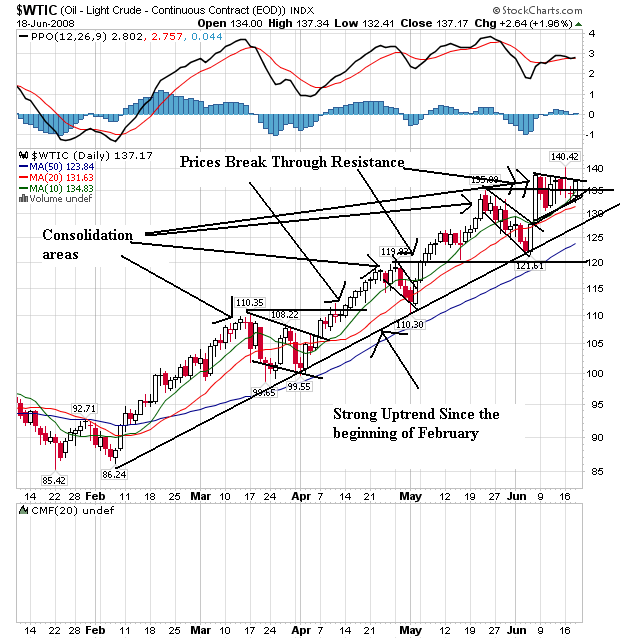
On the daily chart, notice the following:
-- Prices are higher than all the SMAs (although just barely in the case of the 10 day SMA).
-- The shorter SMAs are above the longer SMAs
-- All the SMAs are moving higher
This is a bullish chart, plain and simple.
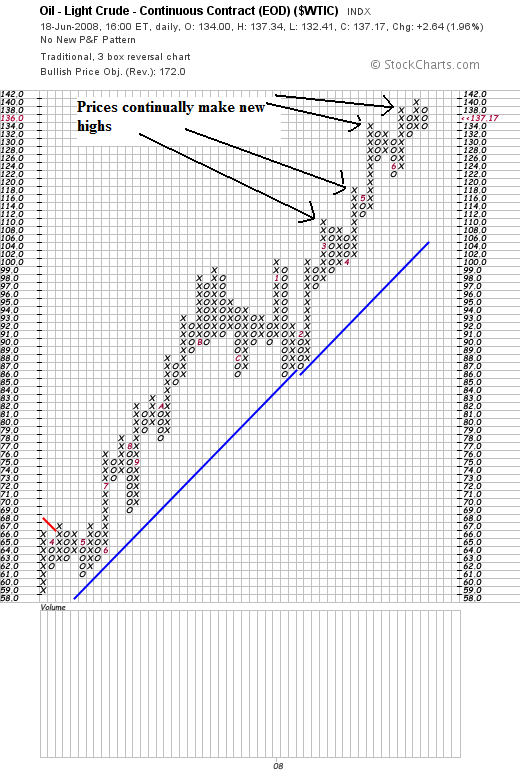
On the P&F chart, notice that prices have continually made new highs.
The bottom line is this: despite all the price fluctuations we've read about over the last few weeks, oil is still in a solid bull market. In addition, it's going to take a lot for that to change at this point.