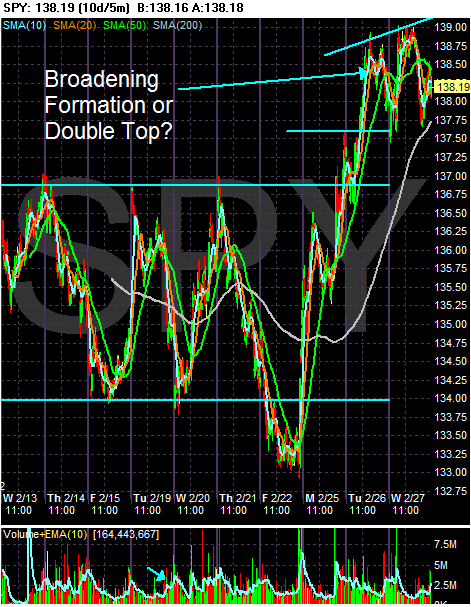
On the 10 day chart, notice the following:
-- The trading range is pretty clear and the current price action is above the range.
-- The index could be forming a double top or broadening formation. Both are considered reversal formations.
Considering that Bernanke said he would lower rates again, this reaction is pretty weak.

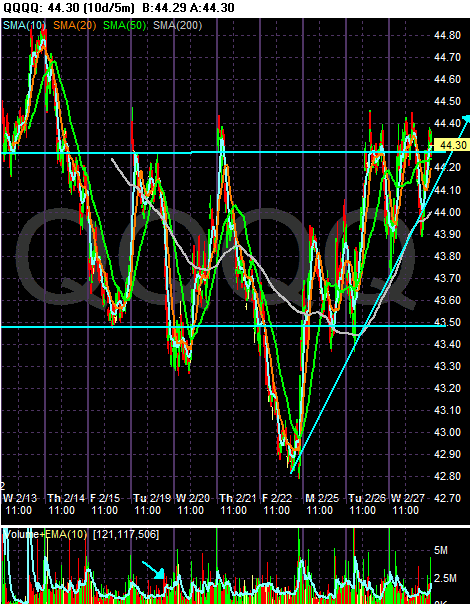
The 10-day QQQQ chart shows the clear trading range this index is in.

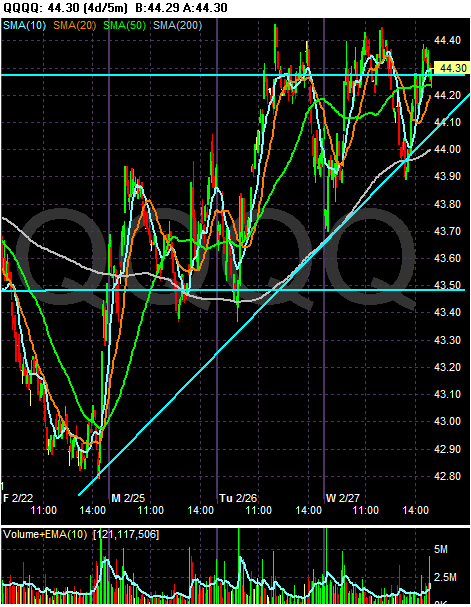
However, the 4-day chart shows an uptrend in place, albeit is weak one. But, it is there.

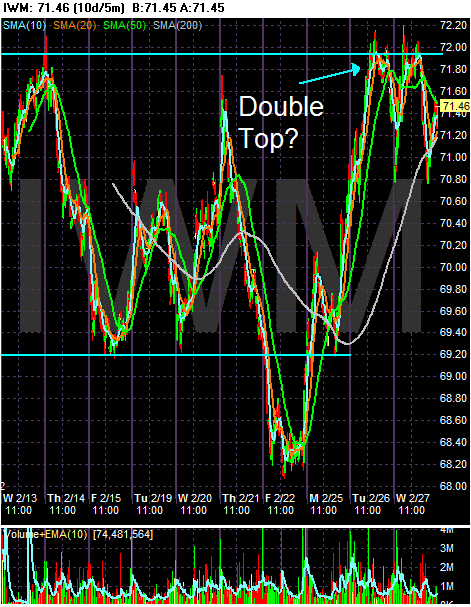
The IWMs have run into strong resistance right around 72 and may have formed a double top as well.
Yesterday, the SPYs broke out of their range with a strong move upward. Today they consolidated that move, but not other index followed higher. If the indexes wanted to move higher, today would have been the day with the Fed's talk of more easing.