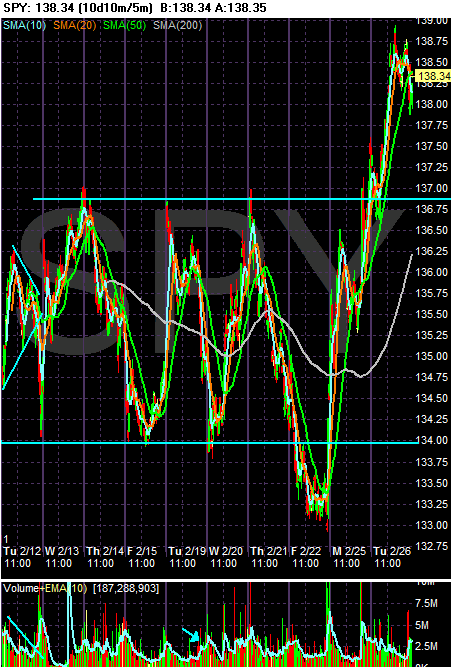
Above is a 10 day chart of the SPYs in 5-minute increments. Notice the strong rally over the last 2 days from 133.15 (approximately) to 138.34 -- an increase of about 4%. That's a big move, although the back and forth action of the last 10 days has muted its importance.
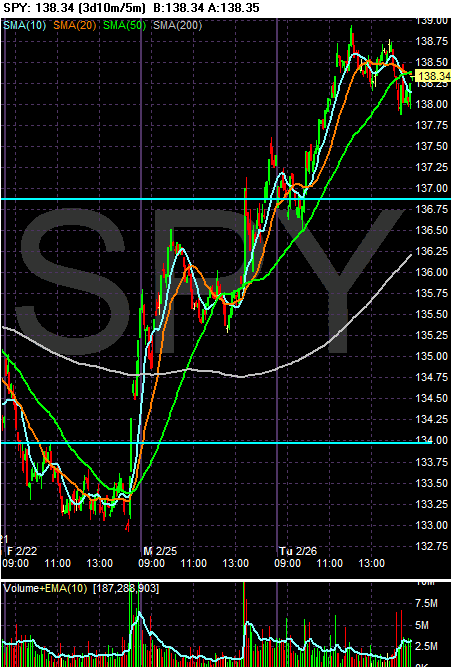
On the three day chart, notice the following.
-- Yesterday's rally started with a gap up. This is very positive.
-- There are three distinct higher high and higher low areas on since yesterday.
-- The market has been able to hold onto its gains for two days in a row.
These are all positive developments and may indicate the SPYs are moving higher.
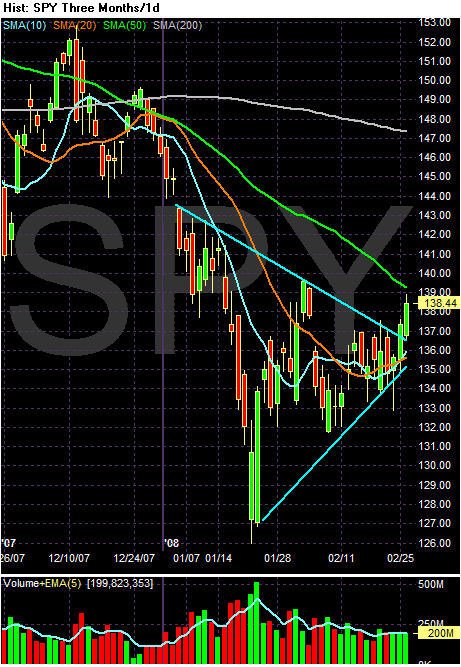
On the daily chart, notice the SPYs have clearly broken out. The question is can they maintain their momentum?
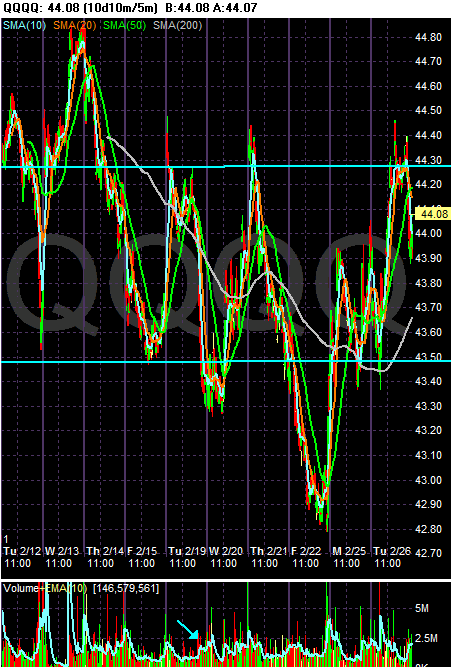
However, the QQQQs are still trading in a range.
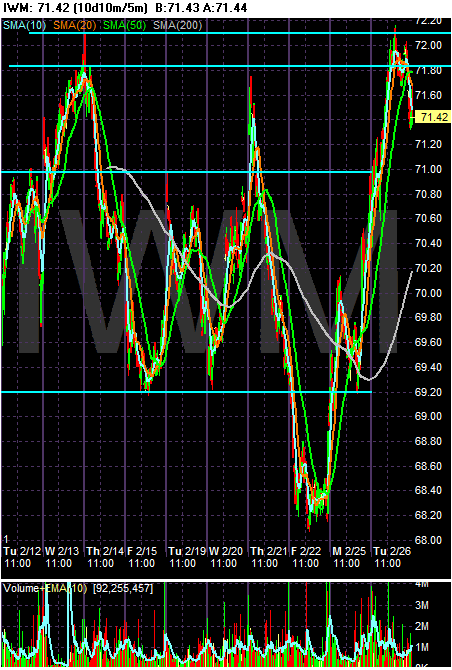
Thee IWMs are at the top of their trading range.
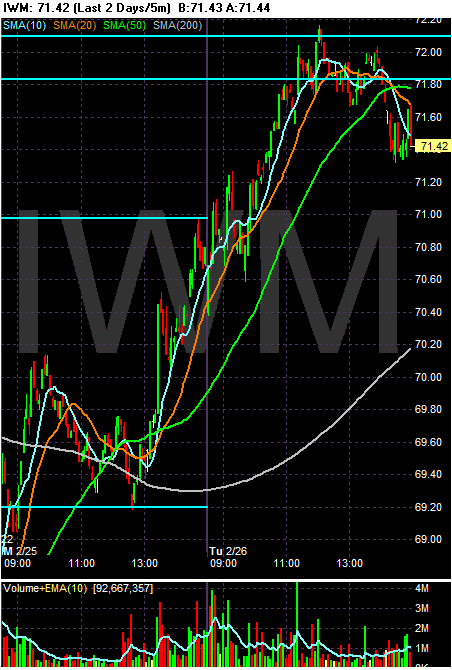
However, the last two days have seen a strong move by the IWMs. Consider the following:
-- The index has moved higher by 3.5%
-- The index has been able to hold onto its gains two days in a row.
-- At the end of trading today, notice the gap down. This would be considered a bearish move, but the index didn't crash.
I'm wondering if the upward momentum from the SPYs continues, will it bleed through to the IWMs?