The S&P/Case-Shiller national home-price index for the fourth quarter fell 8.9% from a year earlier, the largest drop in its 20 years of data. And the Office of Federal Housing Enterprise Oversight's index -- which tracks only homes purchased with mortgages guaranteed by home-loan giants Fannie Mae or Freddie Mac -- was down 0.3%, the first year-to-year decline in the measure's 16 years.
In case you missed it, let's review what we just read. The Case Shiller index had its largest drop in 20 years. And the OFHEO had its first ever year over year decline in 16 years. Those numbers should stick out like sore thumbs because they are. Here's a graph from the same article which shows the severity of the declines:
Prices aren't just correcting -- they're plummeting hard right now.
Let's take a closer look at the Case Shiller Index:
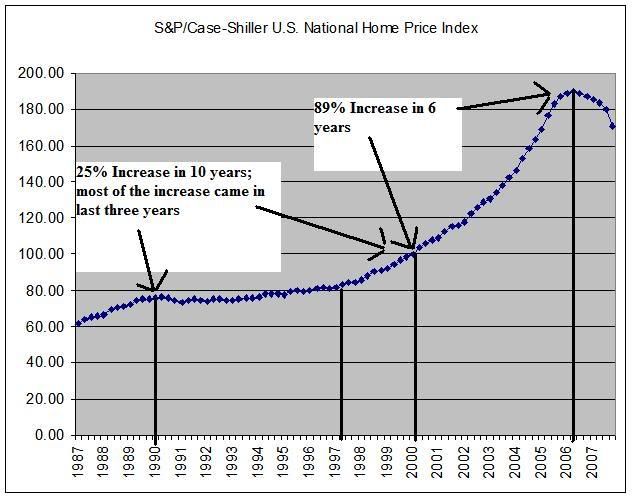
Notice the following:
-- Prices barely increased for the first half of the 1990s expansion. They did increase by 25% over the last three years of the expansion.
-- Prices continued to increase during the slow growth of the early 2000s.
-- Prices exploded higher from 2003 onward.
Notice the difference between the two expansions. The 1990s and 2000s both saw economic growth. Yet home prices really accelerated in the 2000s for a variety of reasons.
Let's ask an important demand side question: was there a big difference from a demographic perspective between the 1990s and 2000? Did the US population explode higher? Did the US accept a whole lot more immigrants? The answer to both is no.
What the chart shows is prices rose far above their historical norm. That means we have a long way to go before prices correct to their historical norm. And it's important to remember a basic economic fact at this point: prices have a strong tendency to revert to their mean/median historical price.
Here is a chart of total inventory of existing homes available for sale (thanks to Calculated Risk)
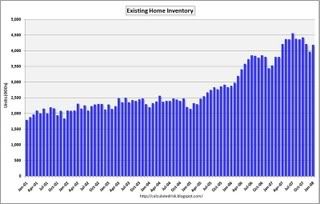
The total number of existing homes available for sale has nearly doubled since 2001. There is simply no way that US demand for housing also doubled in the last 8 years. As a result, we have a ton of inventory to work off.
And the number of months of inventory as a percentage of the current sales rate is still incredibly high:
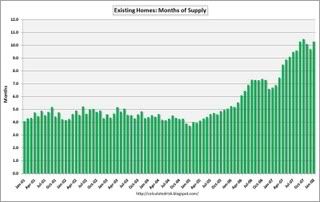
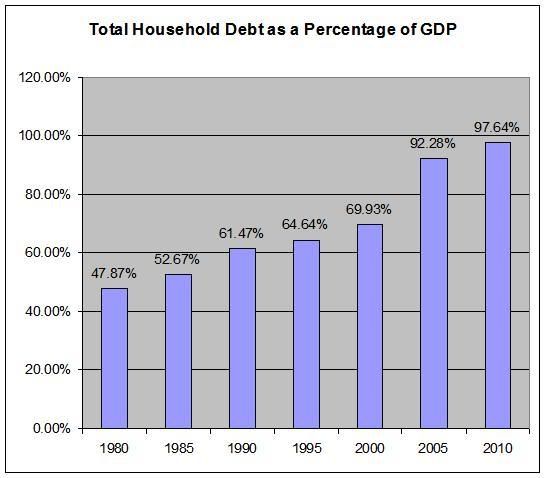
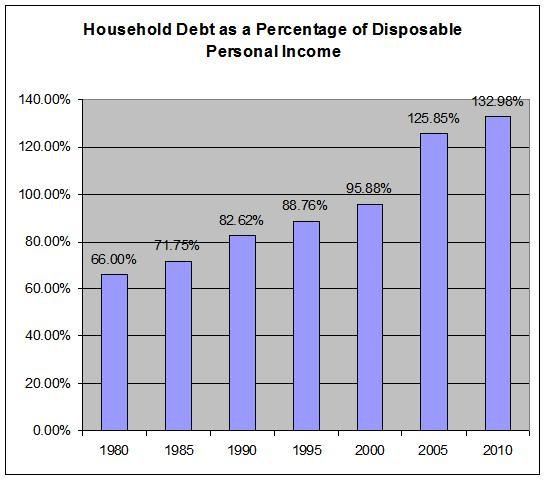
But the final problem is who's going to buy it? Even if there was a commensurate increase in demand, the US consumer is already in debt up to his eyeballs:
Let's review the basic points above:
1.) House prices are historically out of whack in a big way. They are far too high and need to come down.
2.) There is a boatload of inventory on the market.
3.) The sales pace is slowing.
4.) The US consumer is already in debt up to his eyeballs, indicating his ability to take out more mortgage debt is severely compromised.
Put in econ terms we have
Increasing supply and
Decreasing demand
which equals
Lower prices.