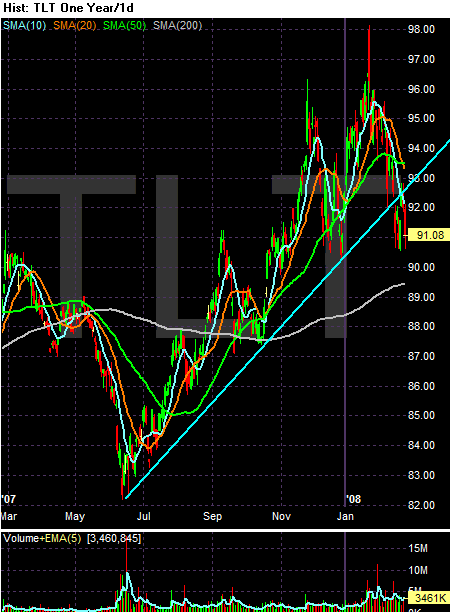
First, the one year chart shows a clear break of the uptrend.

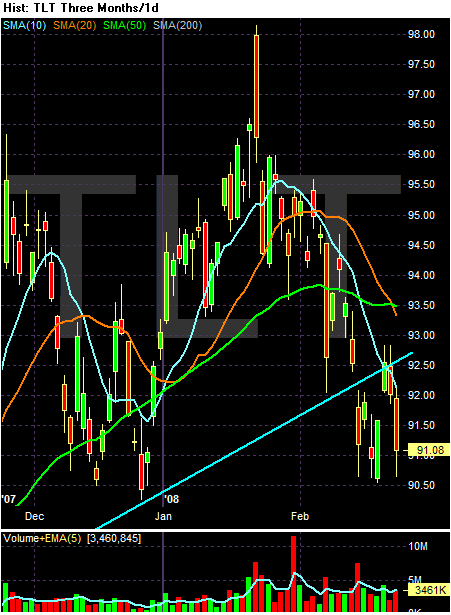
But looking closer at the chart notice
-- Prices gapped down through the trend line.
-- Prices rose to the trend line
-- Prices have since retreated.
For this to be a clear trend break this trend will have to continue with the TLTs making a strong move below the 90.50 area.