The Producer Price Index for Finished Goods rose 3.2 percent in November, seasonally adjusted, the Bureau of Labor Statistics of the U.S. Department of Labor reported today. This gain followed increases of 0.1 percent in October and 1.1 percent in September. At the earlier stages of processing, prices for intermediate goods moved up 3.7 percent after rising 0.1 percent in the prior month, while the crude goods index increased 8.7 percent following a 2.4-percent advance in October.
.....
Before seasonal adjustment, the Producer Price Index for Finished Goods advanced 1.6 percent in November to 171.3 (1982 = 100). From November 2006 to November 2007, prices for finished goods rose 7.2 percent. Over the same period, the finished energy goods index climbed 23.6 percent, prices for finished consumer foods increased 7.3 percent, and the index for finished goods other than foods and energy moved up 2.0 percent. For the 12 months ended November 2007, prices for intermediate goods increased 8.1 percent, while the crude goods index jumped 22.4 percent.
From the BLS:
The Consumer Price Index for All Urban Consumers (CPI-U) increased 0.6 percent in November before seasonal adjustment, the Bureau of Labor Statistics of the U.S. Department of Labor reported today. The November level of 210.177 (1982-84=100) was 4.3 percent higher than in November 2006.
.....
During the first eleven months of 2007, the CPI-U rose at a 4.2 percent seasonally adjusted annual rate (SAAR). This compares with an increase of 2.5 percent for all of 2006. The index for energy, which increased 2.9 percent in 2006, advanced at an 18.1 percent SAAR in the first 11 months of 2007. Petroleum-based energy costs increased at a 30.8 percent annual rate and charges for energy services rose at a 3.2 percent annual rate. The food index has increased at a 5.3 percent rate thus far in 2007, following a 2.1 percent rise for all of 2006. Excluding food and energy, the CPI-U advanced at a 2.4 percent SAAR in the first 11 months of 2007 after increasing 2.6 percent in 2006.
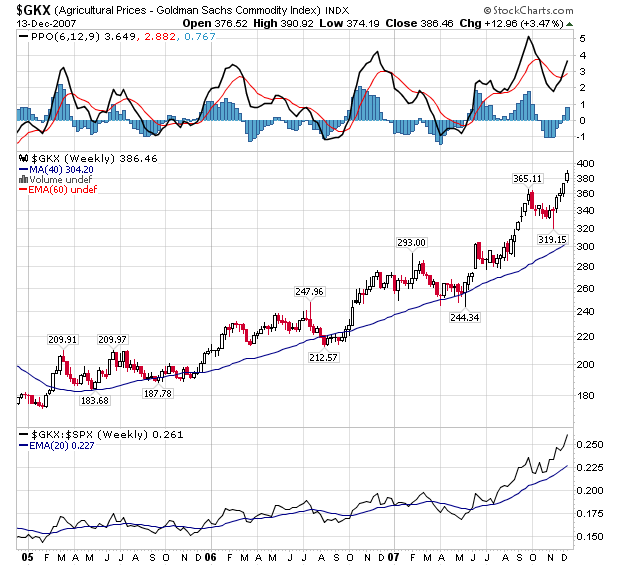
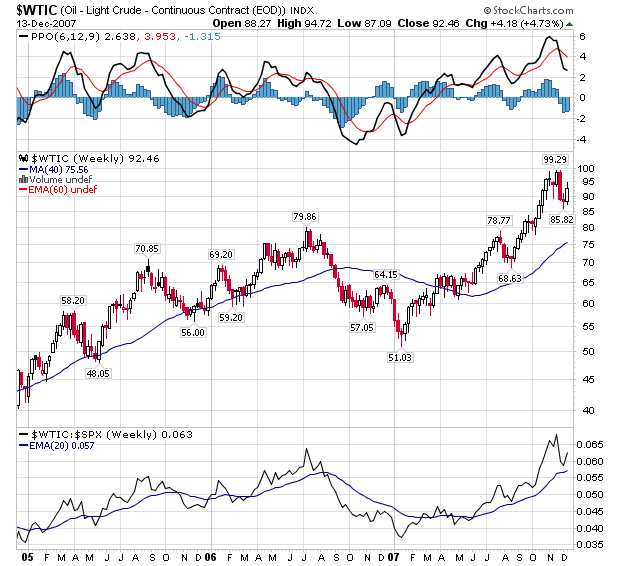
The Fed is now in a really terrible bind. The economy is clearly slowing so they want to lower rates. But look at the yearly increase in food and energy costs at both the wholesale and consumer level -- those are big jumps. These charts --
for agricultural prices

and oil

are really starting to hurt. That means the Fed is pretty much hemmed in. If they lower rates further they run the risk of getting seriously behind the inflation ball. But if they don't lower rates, the stand the chance of getting behind the economy ball.
I think these inflation figures are one of the reasons the Fed signed up with all those other central banks. That would allow the Fed to add liquidity without lowering rates and possibly stoking inflation further.
Either way, Bernenake and company have a really terrible policy choice ahead of them.