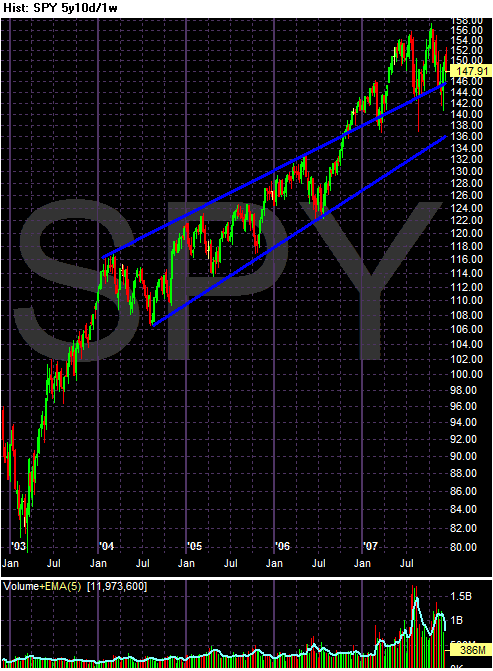
Starting in 2004, the SPYs began a multi-year trend channel. The SPYS broke out of this channel in late 2006 and have used the upper trend channel as support for a rally ever since. The SPYs are currently on top of this trend line still and have use it as support three times in the last year (see chart below).
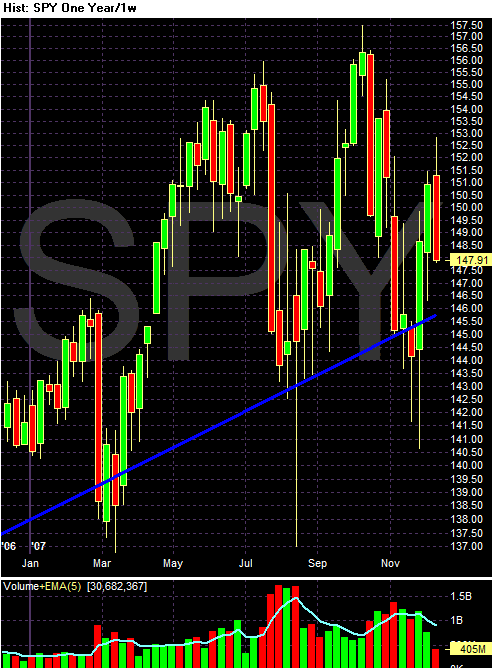
So long as the SPYs stay on top of this upper trend line they will be in decent technical shape. Even if they fall through this line they will still have the lower trend line as support. The lower trend line is about 8% below the SPYs current level.
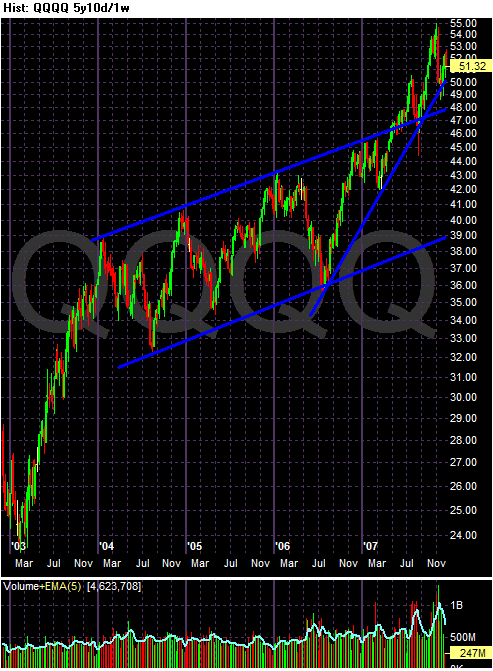
The QQQQs have two primary trends sill in place. The first is an upward sloping channel that started in early 2004. The second is a rally that started in mid-2006. However, the second rally no longer has a pattern of higher lows and higher highs. However, the QQQQs have not broken major long-term support for either rally yet. So the QQQQQs are still in good technical shape.
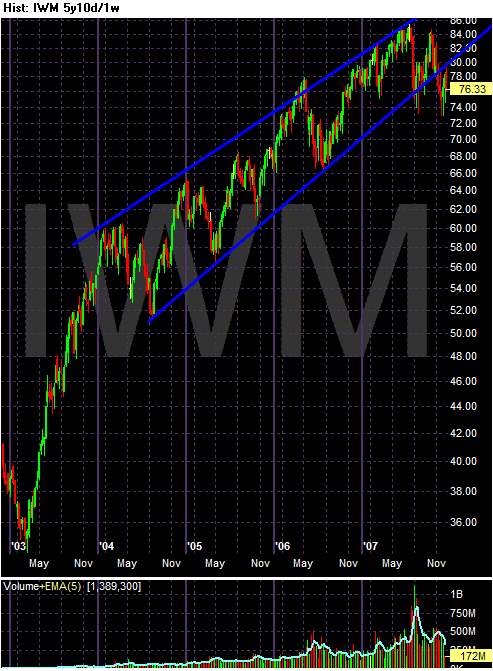
Like the QQQQs and SPYs, the IWMs started a long-term uptrend in early 2004. However, the IWMs have broken the long-term lower trend line and have since run into resistance at the lower trend line. This should concern traders. The Russell 2000 is an index of smaller cap stocks. These companies need a growing economy to increase their respective earnings. When this index declines, it is probably a sign that traders are not happy about the economy's prospects. In addition, the index's finding resistance at previous support is a technically concerning event.
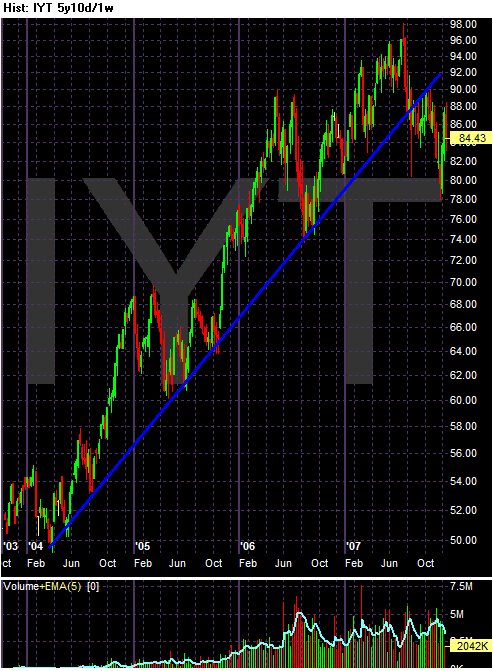
The Transports broke a three and a half year uptrend last summer. They tried to rally beyond this trend line and failed. In addition, they have been in a clear downtrend since mid-summer. In other words, the transports are not confirming any upswing in the broader market. For those of us who still think Dow theory is relevant, this is a very troubling development for the broader markets.
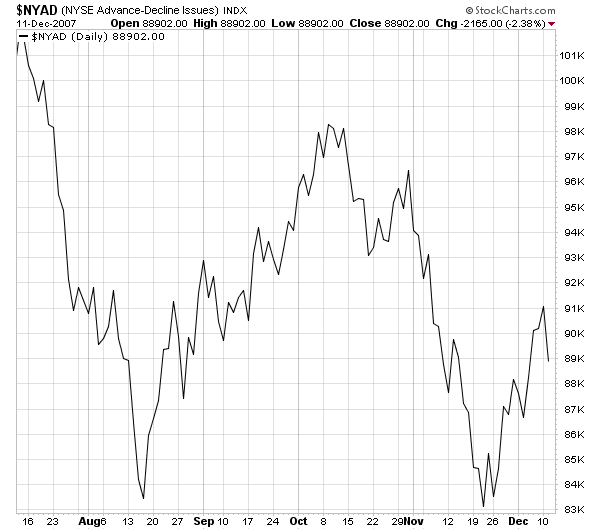
The New York Advance/Decline line has been increasing since late November. This is a good development.
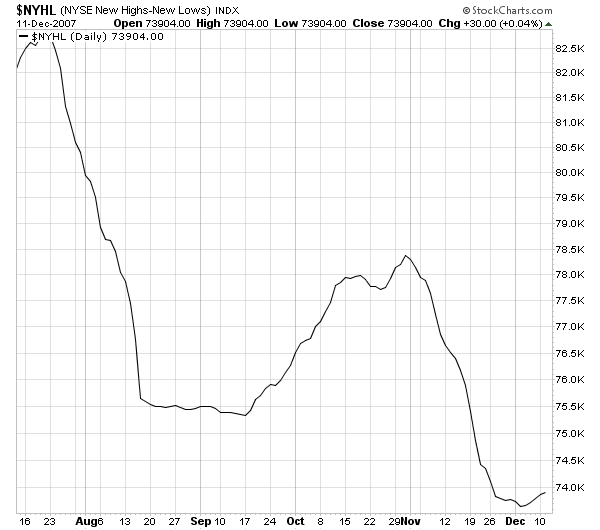
The new high/new low line may be bottoming. Considering the length of time this index was decreasing it's understandable it would take awhile to turn around.
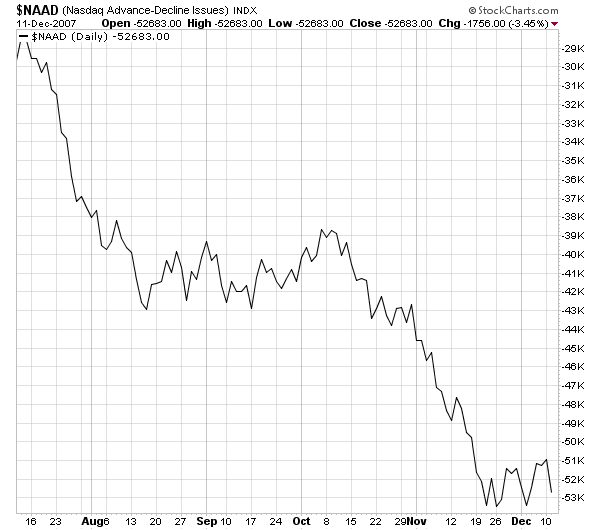
However, the NASDAQ advance/decline line is very troubling. This index has been rising far about two weeks, yet the A/D line is still stuck in a rut. This may indicate that a small number of companies are responsible for the last few week's upward move which is not the sign of a healthy advance.
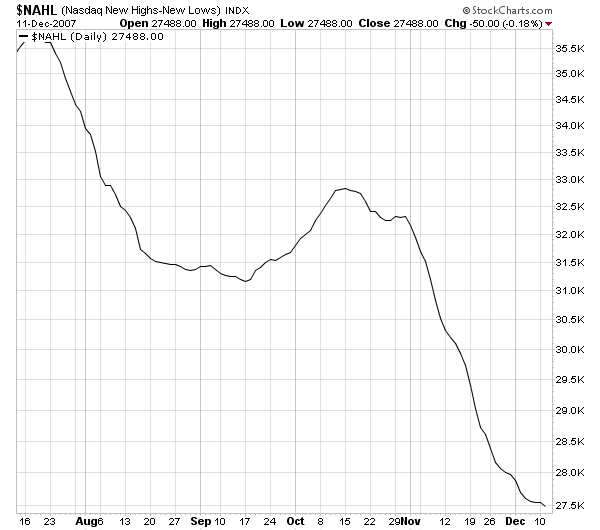
And the NASDAQ new high/new low index is still decreasing, which is another troubling sign.
A few weeks ago I wrote a long article titled Is a Bear Market Developing. While the New York A/D line has gotten better since them, the Russell 2000 and Transports have at best treaded water. In addition, the NASDAQ's new high/new low index is very troubling, as is the NASDAQ's A/D line. The dollar is still in a downtrend, oil is still high and the Federal Reserve is looking like they are behind the curve. Housing is still a huge problem, corporate earnings are not good, and confidence is low. In short, there is still a ton of negativity out there in the economy. The fundamental picture is weakening and I would still expect the technical picture to follow-suit at some time. In essence, I expect the Russell 2000's and the Transport's moves to recur in the SPYs and QQQQs.