Sack, head of monetary and financial market analysis at the Fed in 2003 and 2004, uses a chart that plots forward rates measuring investor expectations for inflation in five years. The gauge is so accurate that Sack and his colleagues persuaded the central bank to use it to help set policy. The chart is autographed by former Fed Chairman Alan Greenspan.
Right now, it shows current Fed Chairman Ben S. Bernanke may have less room to lower borrowing costs than investors in Treasuries anticipate, potentially setting bondholders up for a fall. The expected inflation rate, which Sack says replicates what Fed officials use, reached 2.91 percent last week, the highest since 2004, when the central bank began the first of an unprecedented 17 rate increases. The measure was at 2.79 percent on Nov. 1.
.....
Futures on the Chicago Board of Trade show a 100 percent chance the Fed will lower its target for the overnight lending rate between banks by at least a quarter-percentage point to 4.25 percent, the third cut since September. The chances are at least 50 percent that the Fed will cut again at its next two meetings, on Jan. 30 and March 18.
The gauge used by Sack, dubbed the five-year five-year forward breakeven inflation rate, suggests bets on lower Fed funds rates may be too bold. The fact that the rate stayed steady for much of the past two months as pessimism about the economy grew bolsters that view, said Michael Pond, an interest- rate strategist in New York at Barclays Capital Inc., one of the 20 primary dealers of U.S. government securities that trade with the Fed. A cooling economy typically tempers inflation concerns.
``The market, by keeping the same inflation expectations while lowering growth expectations, is implying there are inflationary pressures,'' Pond said. He held to that view even as the forward rate fell last week.
I've never been a big fan of economic models. To me, it's simply too hard to predict behavior no matter how complex the model is. Of course, that's just me. There are plenty of people who have an incredible ability to derive relevant data points from available information.
However, simply looking at carious charts and reading earnings announcements from last quarter, it's obvious there are price pressures in the system which the "official" inflation measure misses, discounts or does not capture fully.
There are two charts which I have referred to several times over the last year that illustrate this point.
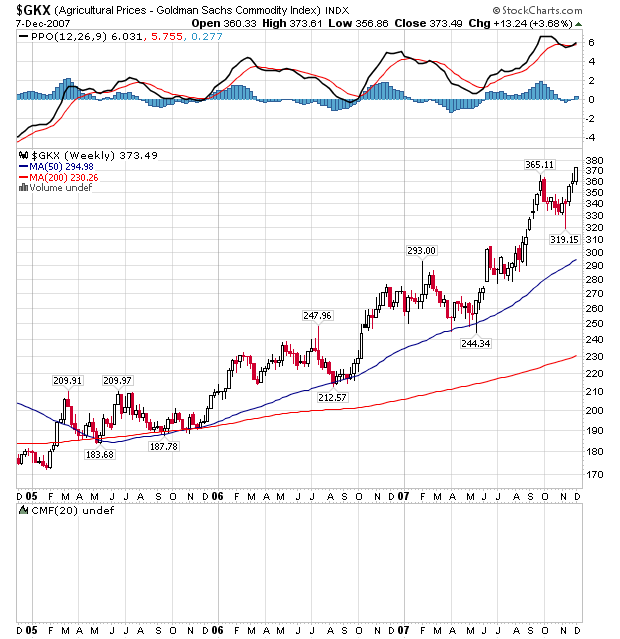
Agricultural prices have been consistently rising for the last two years. This is something I have noticed at the store and in conversations with other people.
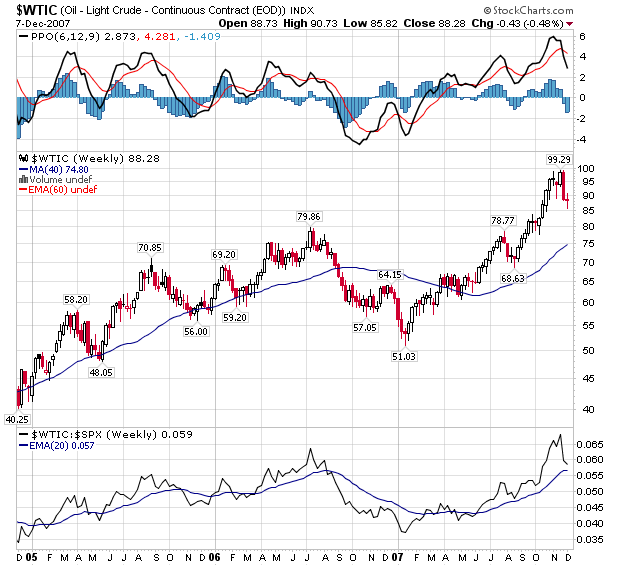
Oil prices are another area there prices are consistently increasing.
The previous charts tell me that prices are increasing on goods that people buy every day. Considering the length of time these prices have increased, it's entirely conceivable that people are starting to adjust their long-term inflation expectations higher.
Last Wednesday, I observed that treasury yields were at very low levels. I then asked the question can the Treasury rally continue when yields were that low by historical standards? The Bloomberg article above indicates Treasury traders may be switching their focus to inflation and the possible negative inflationary implicatiosn from another Fed rate cut, especially in light of the price charts for agricultural and oil products. If that is the case, then credit market concerns may be taking a backseat to this renewed interest in inflation.