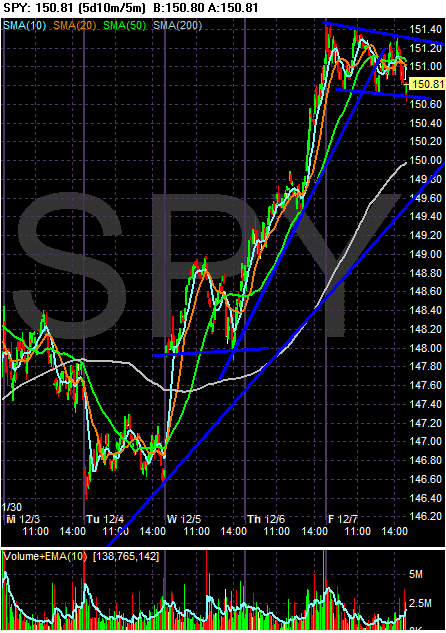
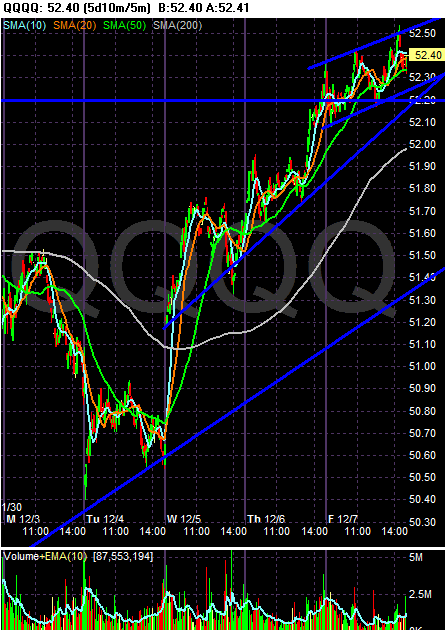
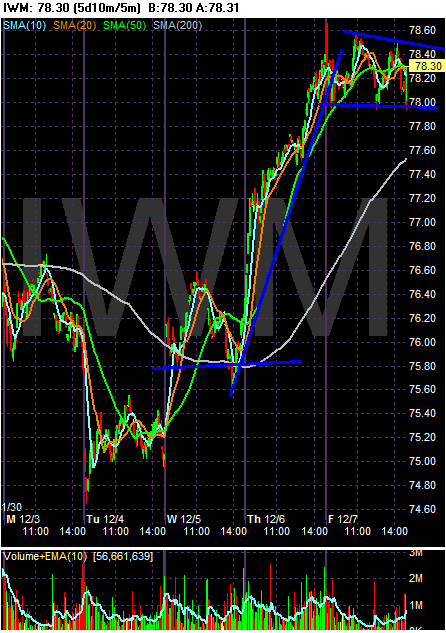
All three markets rose from Tuesday through Thursday. On Friday, the SPYs and IWMs consolidated in a flag pennant which the QQQQs also consolidated but in an upward sloping pennant formation.
These charts tell us the markets are rallying. The question is will this rally continue in light of the Fed's meeting next week? While no one can answer that, let's look at the daily charts to see what they say
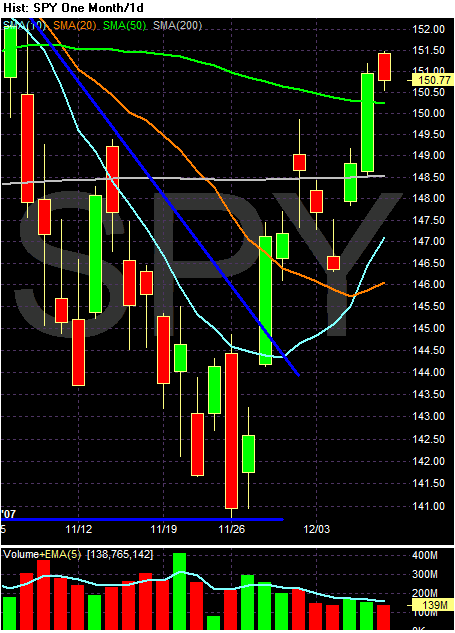
The SPY chart is in a very strong trend reversal right now. Prices have moved through downside resistance, and all the simple moving averages. The SMAs will now provide downside support for a sell-off. Also notice the 10 day SMA is moving higher and has crossed over the 20 day SMA and the 20 day SMA is beginning to move higher as well. In addition, there are no SMAs to provide any upside resistance.
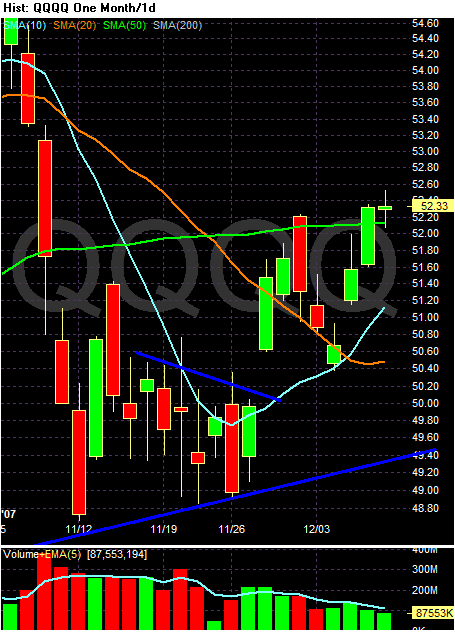
The QQQQs are already above the 200 day SMA. Now the average has broken the triangle consolidation and moved through the 10, 20 and 50 day SMA. As with the SPYs, the SMAs will now provide downside support for a sell-off. Also notice the 10 day SMA is moving upwards and has crossed teh 20 day SMA. In addition, there are no moving averages to provide upside resistance.
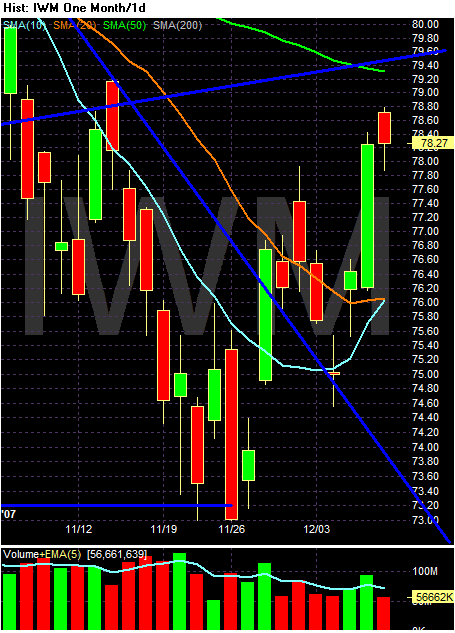
The IWMs have moved through the 10 and 20 day SMA, but are still below the 50 and 200 day SMA. However, the 10 day SMA has moved higher and is about to cross the 20 day SMA.
Both the SPYs and QQQQs have room to run higher -- they have little technical upside resistance. Combine that with the natural beneficial effects of a rate cut and you have good reason to expect these indexes to move higher on positive Fed action.
The IWMs are a bit dicier because they are still below the 50 and 200 day SMA. These will provide upside resistance to a rally. In addition, the Russell is the riskiest of indexes so they may not benefit as much from a rate cut. However, if the SPYs and QQQQs start to run, I would expect a bleed over effect into the Russell as well.