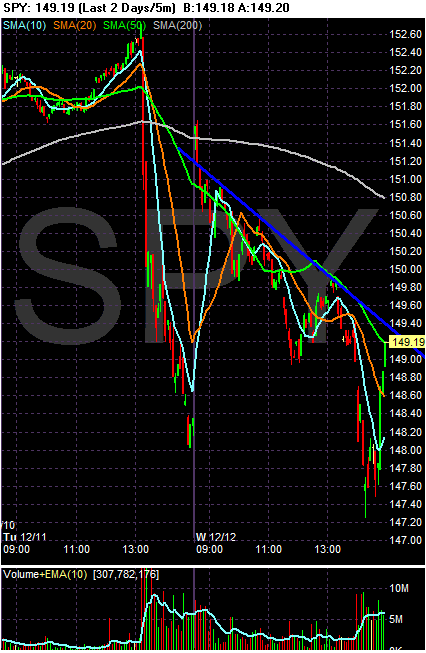
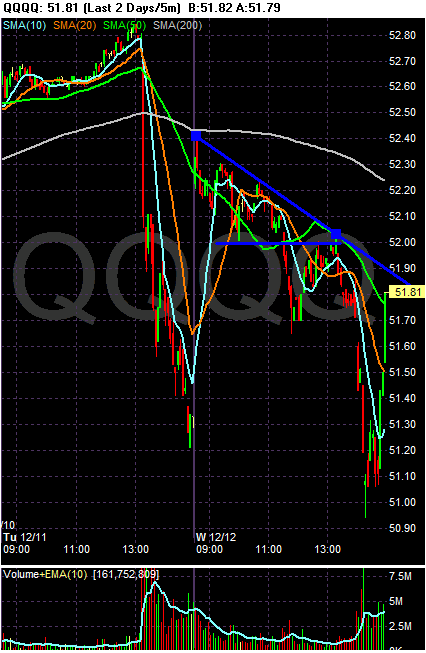
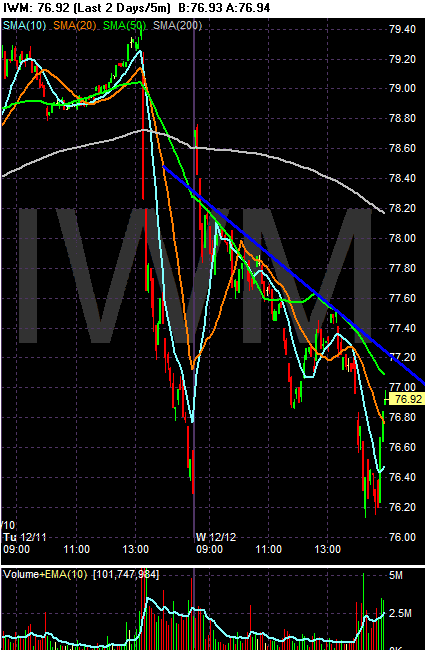
On all of the daily charts we have an inside day -- a day when the highs and lows are inside the previous days highs and lows. This is like a mini-triangle pattern.
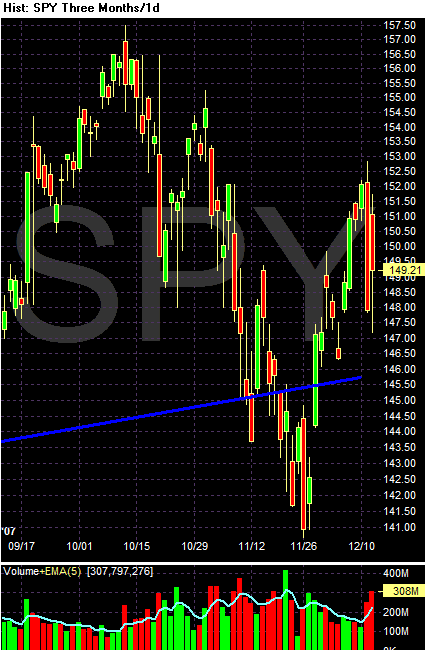
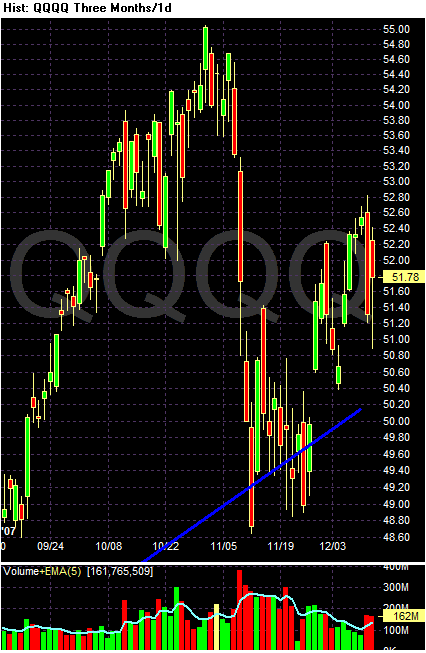
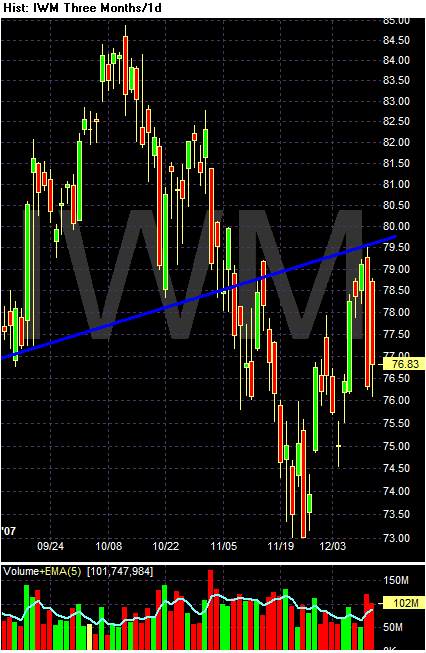
Today was extremely volatile. Anytime there is a change in sentiment of the degree we saw today you have to wonder what is going on. Instead of there being a more uniform view of the market -- that is, a majority of traders think the market is going firmly in one direction or the other -- today was extremely varied. The bears were in full force until the very end when the bulls took over.
Traders are trying to figure out exactly what is going on. And no one is really sure just yet.