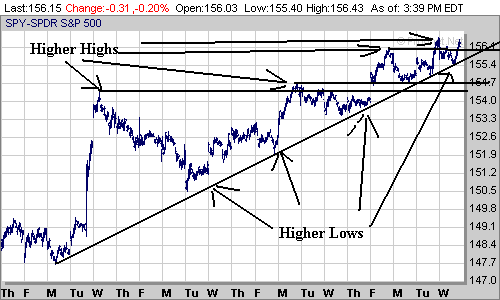
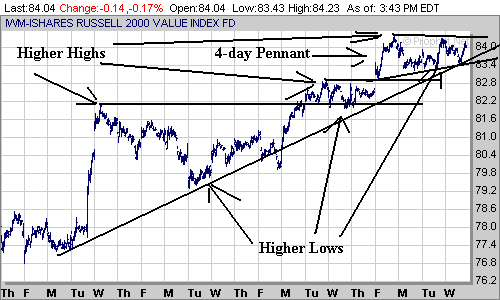
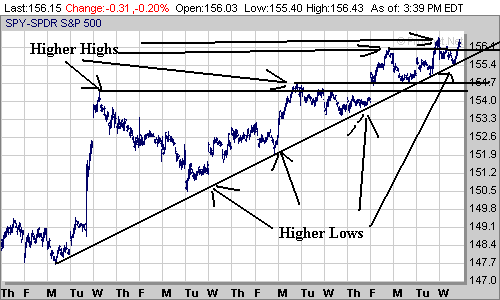
I'm going to break some tradition today. Normally, I use charts from Quotetracker, which is the market tracking software that I use. Today I'm going to use some charts from prophet.net because their daily charts go back a bit farther. The Fed lowered rates on September 18, which was 16 trading days ago. The following charts go back 20 days. They are of the SPY, IWR (mid-cap) and IWM -- Russell 2000 (small cap). All three charts show the markets are moving up along a nice trend line. All three are making higher highs and higher lows.
The bottom line is since the Fed's rate cut the markets are doing well.


