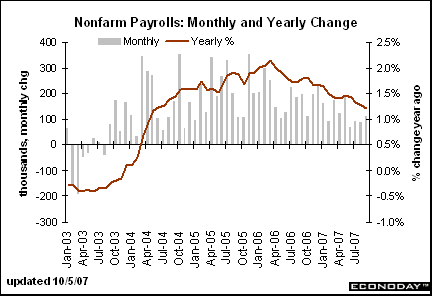
The labor participation rate has dropped since the beginning of the year.
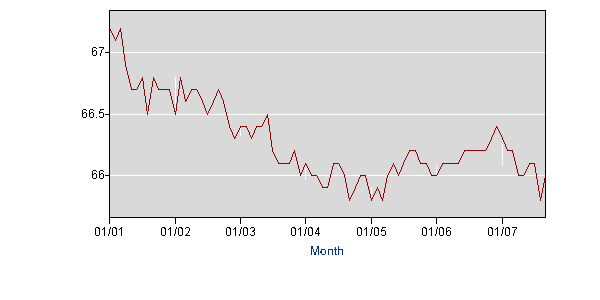
And the median duration of unemployment is increasing.
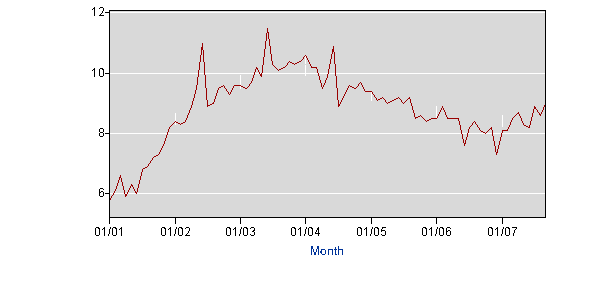
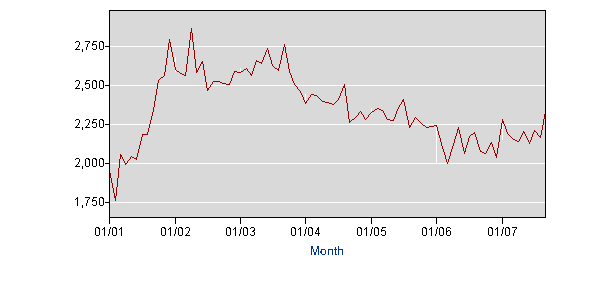
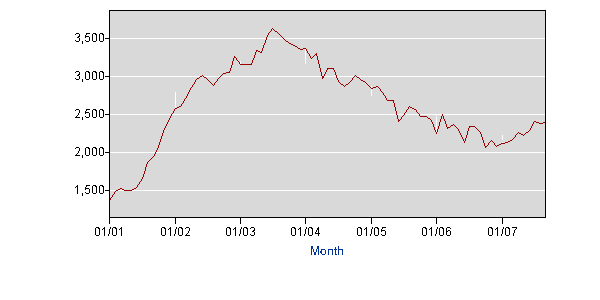
The number of people unemployed for particular periods of time is increasing as well:
Unemployed for 5 weeks and under is edging up.
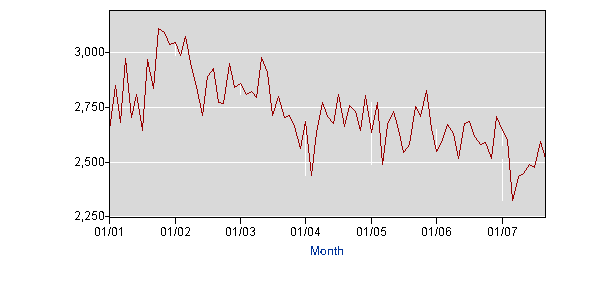
Unemployed for 5 to 14 weeks
Unemployed over 15 weeks
And from Econoday, we have the following chart. Note the brown line which shows year-over-year percent change.
