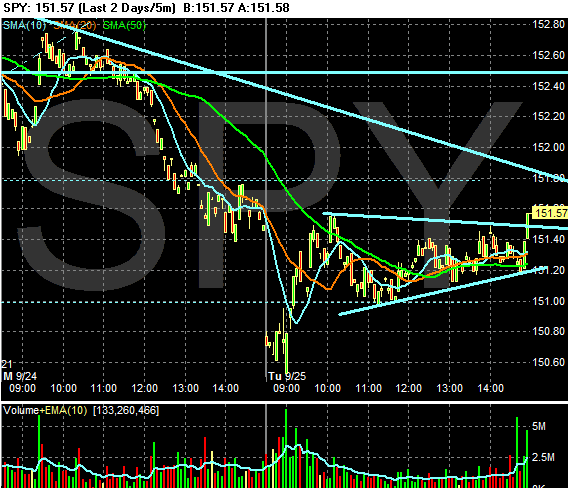
After opening lower, the SPYs went into a triangle consolidation pattern for the rest of the day. However, they did break out of this pattern at the end of trading on good volume. My guess is this was caused by trading programs.
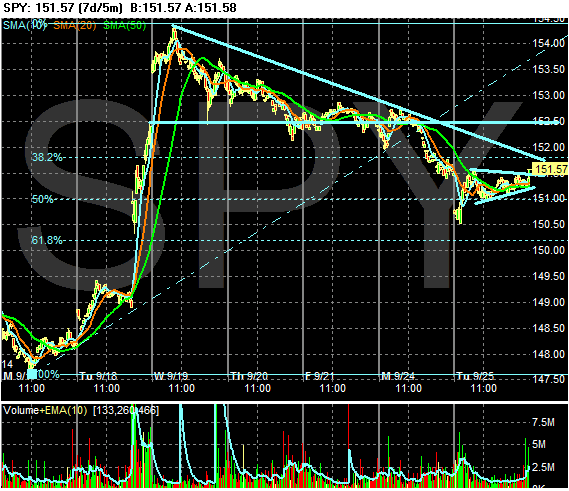
On the five day chart, we definitely have a downtrend in play. However, notice the market is cautiously moving down -- there aren't any serious drops of large magnitude. It's more of a general cautious sell-off. Also notice the market has fo far stair-stepped down the Fibonacci levels established in the rate cut jump from last week.
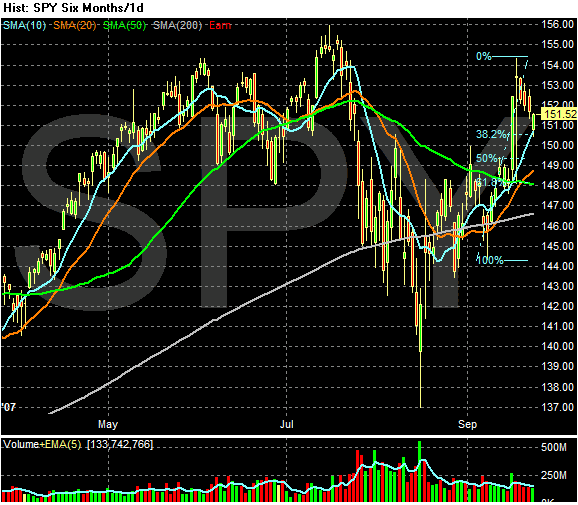
The daily chart shows the SPYs continue in their pennant pattern I first noted yesterday. This is a sign that traders are waiting for something to happen, they just don't know what that something is.
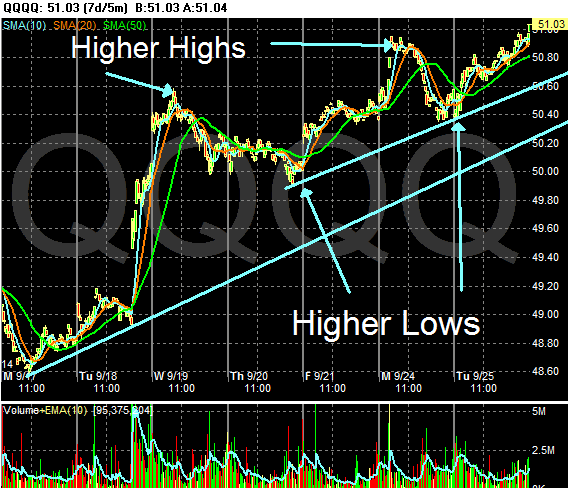
Unlike the SPYs, the QQQQs have continued their rate cut rally. This 70day chart shows a nice pattern of higher highs and higher lows which is the hallmark of any good run. In addition, notice the market closed at its high on a good volume spike. This means traders are continuing to bid up this market.
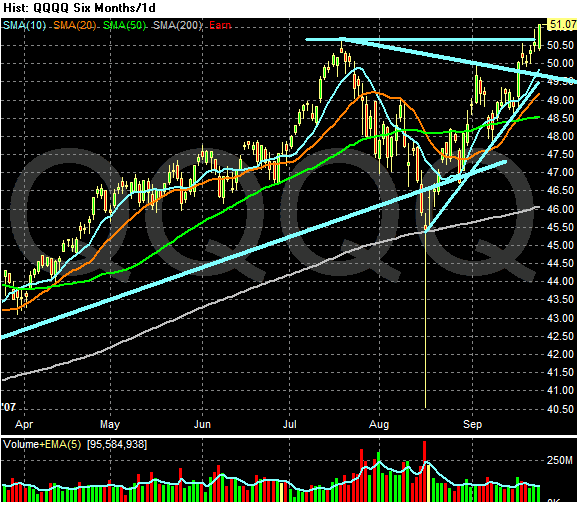
The daily chart of the QQQQs shows they have clearly kept their momentum going. My guess is technology is benefiting for one primary reason: it's not real estate. From its low in August, the QQQQs are up 12%. This move essentially erased all of the losses from the mid-summer sell-off.