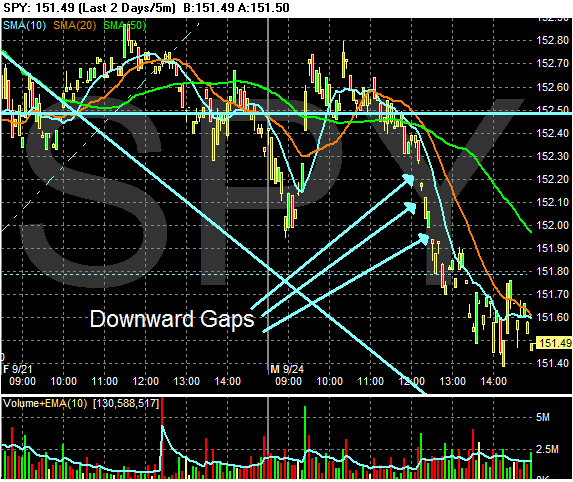
On the two day chart, notice the three gaps down on the way to the afternoon trading level. My guess this was some pretty straightforward profit taking.
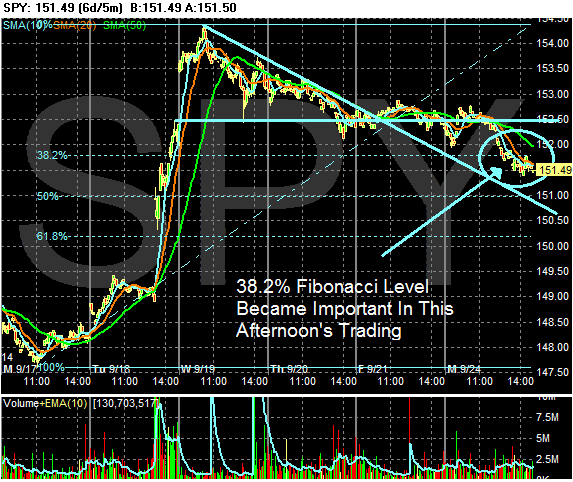
The 6-day chart is key to understanding today's action. First, notice how the market seemed to gravitate to the 38.2% Fibonacci level of the Fed rate cut rally. Once the market got just below that level it stopped and consolidated its losses for the day.
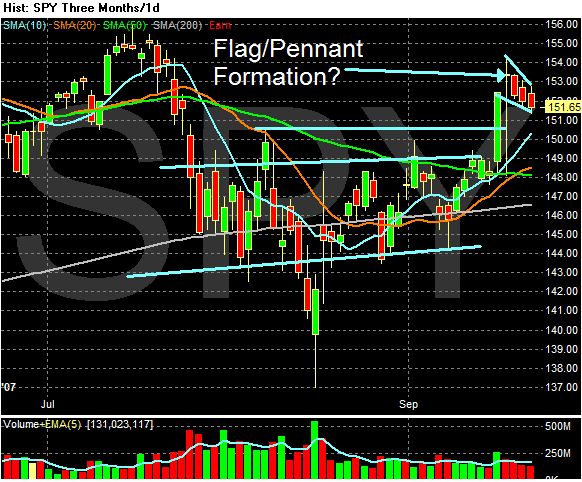
On the daily chart, notice how the market is forming a flag formation. This is usually a signal the market is about to make a move in one direction. We simply don't know which direction right now. Also notice that volume has decreased slightly each day over the last three days, another indication of a pennant formation.
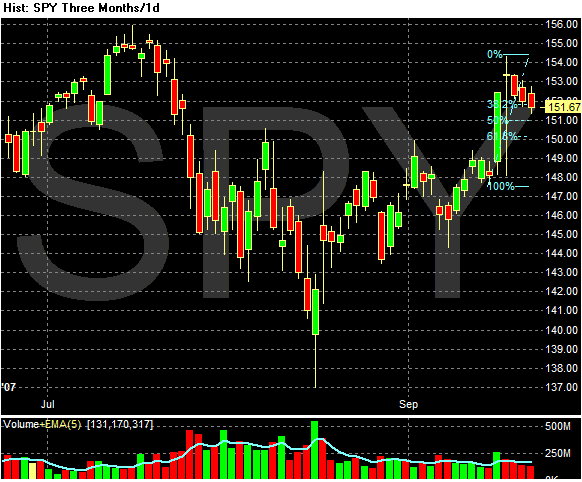
On this chart, notice that if we place the Fibonacci low level a few days ago, then today's close is right at the 38.2% level.
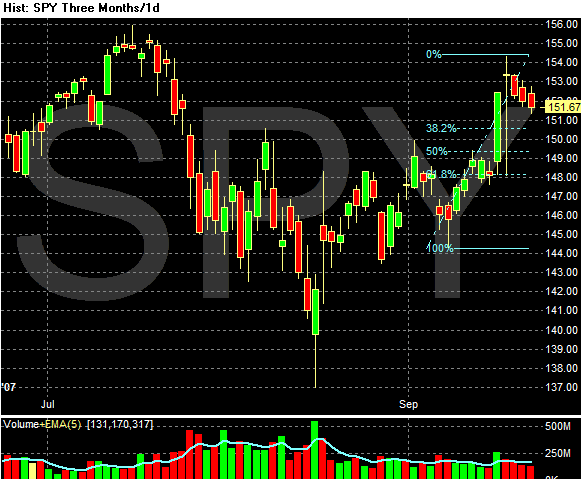
However, if we draw the Fibonacci level from a bit before, we still have a touch to go.
The market is waiting for something. Today's sell-off wasn't severe enough to say the market's tenor has changed. In addition, three days of slight declines is hardly cause for panic.