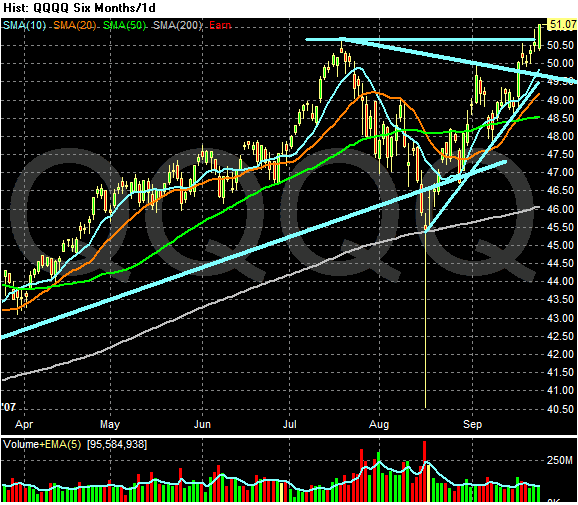
First, here's the overall technology market, as represented by the NASDAQ 100 tracking stock the QQQQQs. It has risen 12% since the bottom of the mid-summer sell-off. It broke through upside resistant yesterday on decent volume. Overall, this is a good chart.
What sub-sectors of technology are doing well?
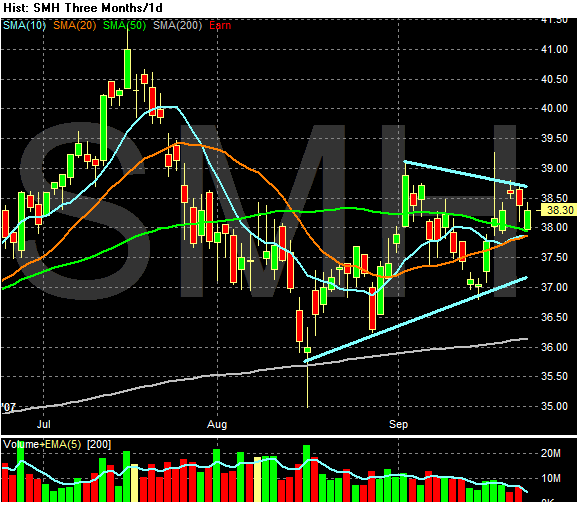
The answer is it isn't semi-conductors. This sector is in a trading range and appears to be forming a triangle consolidation. The moving averages are all clustered, which is not a very bullish sign. There is also decreased volume over the last week, which shows a general lack of interest from traders for this sector.
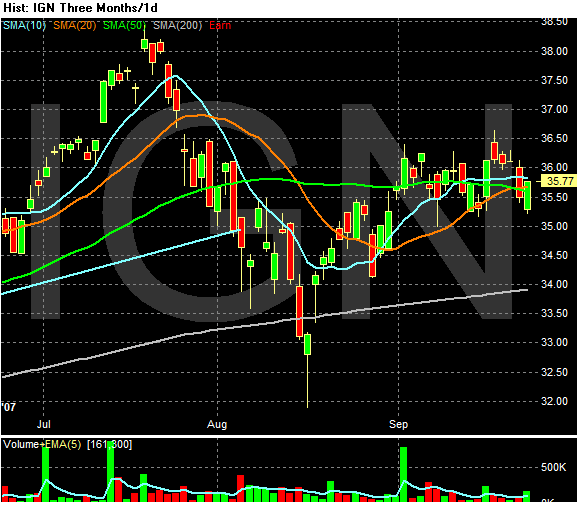
Networking is sort of benefiting. While this sector rose about 10% from its mid-August lows, it is now in a trading range. This range could simply be a consolidation pattern, but we need a move to the upside to see if that is the case. In addition, the moving averages are clustered which should give traders reason to pause.
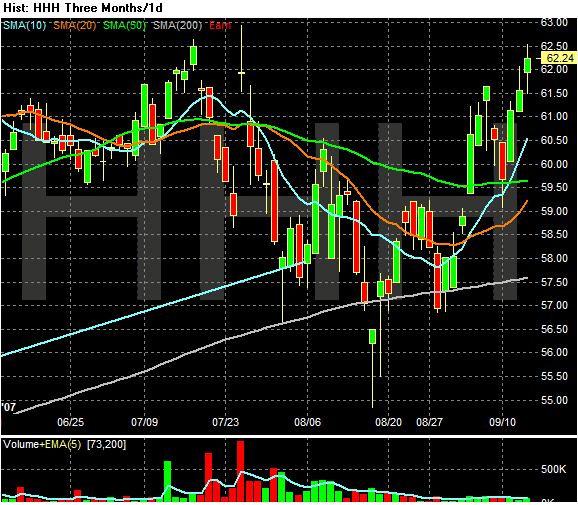
The big internet players have clearly benefited. The HHHs have a major stake in Amazon, Ebay and Yahoo which are three of the largest internet companies around. The 10 day SMA has crossed the 10 and and 50 SMA. The 20 is also moving up. This is agood chart.
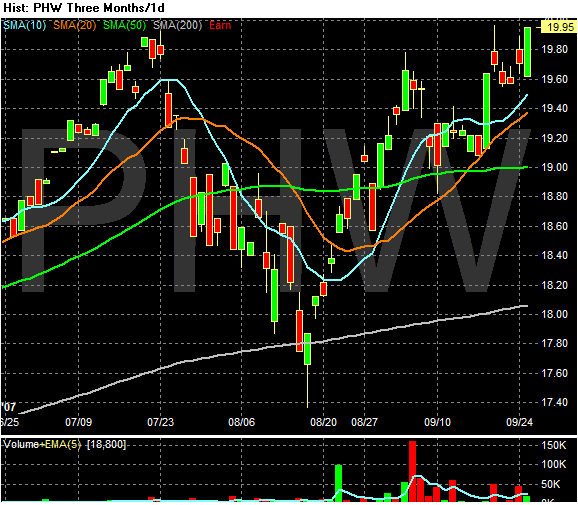
Electronics are also doing well. This ETF's largest holdings are in EMC, Dell, Apple, Sun and Agilent. Again, these are all big, well-established companies. The 10 and 20 day SMAs are moving higher and the 10 day SMA is above the 20 day SMA. The 20 day SMA is also above the 50 day SMA. The only drawback to this ETF is the overall lack of volume.
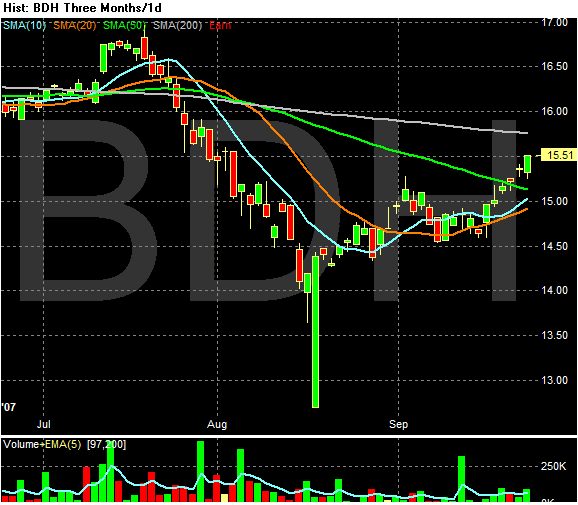
On the negative side, the Broadband sector is trading below the 200 day SMA which is usually considered bearish. However, the 10 and 20 day SMAs are increasing and the 10 day SMA is about to cross the 50 day SMA. However, I would like to see this sector move above the 200 day SMA.
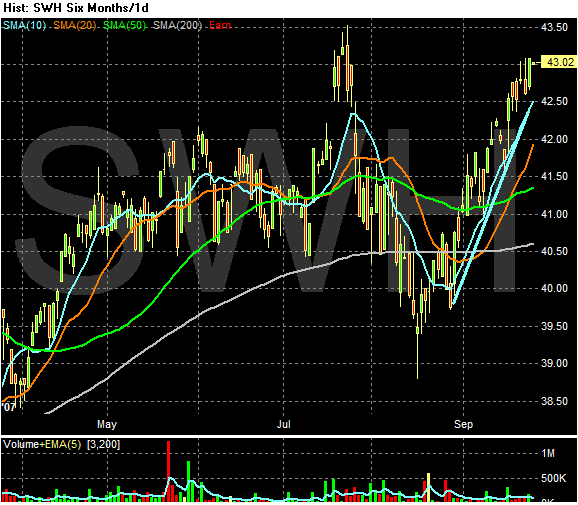
Software is a great chart. The SMAs are arranged from the lowest to the highest, the 10 and 20 SMAs are clearly moving up, the 50 day SMA is beginning to move up and we have a really nice upward moving trend in place. Like most ETFs, this one has big holdings in the large software companies like Microsoft, SAP, Adobe and Oracle.
Aside from semiconductors, the technology advance appears to be pretty broad-based. However, because the ETFS hold large positions in the largest companies in their respective sector, I have to think smaller cap companies aren't benefiting as much from the rally. This is confirmed from the following two charts.
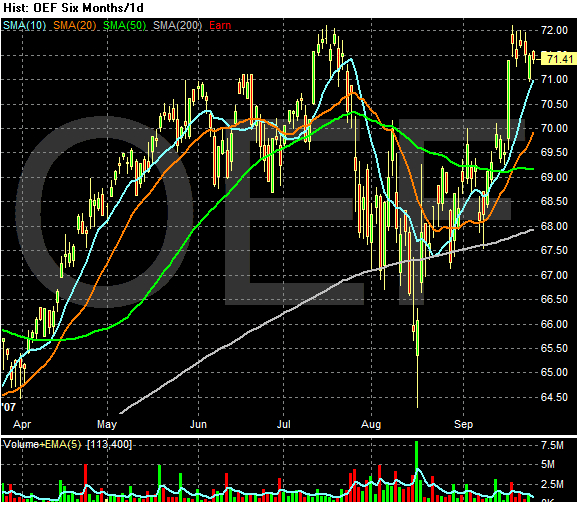
The S&P 100 chart broke out from it's trading range recently,
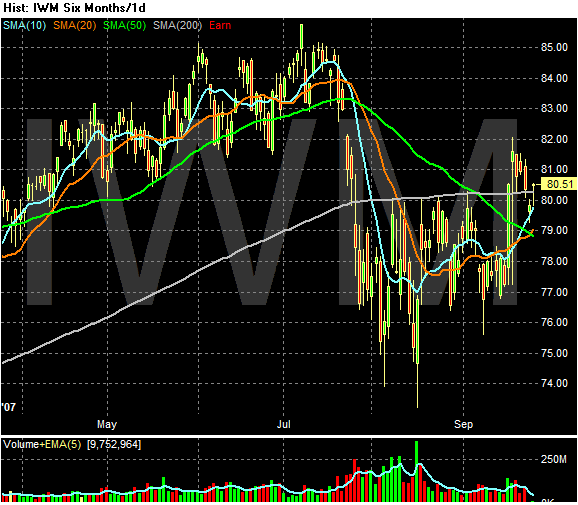
but the Russell 2000 is still languishing.