This is not a very impressive chart.
1.) The red line is drawn from the weekly opening to the weekly close. Notice we really didn't move anywhere.
2.) The upward movement for the week came from opening gaps up. I drew two golden colored lines for Wednesday and Thursday. The line extends from the opening to the close for the day. Notice that prices moved around the opening for those days but then returned to near opening levels at the close. If there was real excitement in the market about future prospects we would have seen a rally during the trading session.
On the daily chart notice we have a lot of weak candles -- candles with very small bodies -- and declining volume for the week.
The 5-day QQQQs are somewhat better, but they still have the same problem as the SPY -- big opening jumps without any follow-through during the trading day. The big difference between the SPYs and the QQQQs is Tuesday when the QQQQs had a good day up and the SPYs dropped at the open.
The 10-day QQQQ chart shows a 10-day uptrend firmly in place. Also note there are two trends in place which should help going forward.
The daily chart shows the QQQQs have broken through resistance but also have the small candle bars and decreasing volume that the SPYs had. This indicates traders are mulling their options. While there isn't enough good news to move higher, there isn't enough bad news to move lower either.
The transportation average isn't confirming. It is trading below the 200 day SMA and all of the shorter SMAs are below the 200 day SMA. If the economy were expanding we would need to transport more stuff from point A to point B. This average isn't saying we have more stuff to transport.
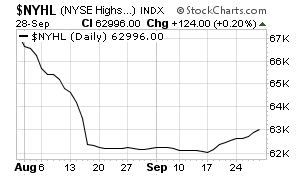
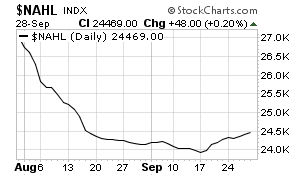
Market breadth is getting better.
The New York and NASDAQ new high/new lows are improving.
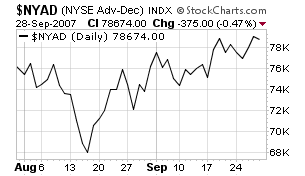
And the NY advance decline line is moving up in a range.
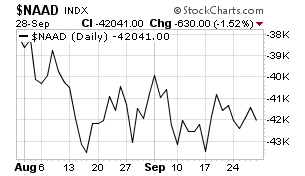
However, the NASDAQ advance/decline line is still in a range.
Barrons' trader's column summed it up best
MATERIAL, INDUSTRIAL AND ENERGY stocks pushing their midsummer highs make this seem, once again, like the best of times. But straggling financial and consumer-discretionary stocks tell a different tale.
Bifurcated markets like today's don't extend forever and often end when the stronger stocks succumb to the same selling pressure hurting the laggards. Many extended material and industrial stocks already reflect the high hopes of global growth, and "things can change quickly when these stocks hit targets and investors decide to take profits," says Oppenheimer's chief market technician, Carter Braxton Worth. In contrast, the concerns dogging financial and consumer stocks won't change overnight.
The market's split personality becomes even more apparent when a stock chart of the uber-miner BHP Billiton (BHP) is juxtaposed against that for uber-retailer Wal-Mart (WMT): BHP has surged 115% over the past year while Wal-Mart is down 11%. Similarly, the world's largest steel company, Arcelor Mittal (MT), is up 143% while one of the largest consumer stocks, Toyota Motors (TM), is up just 7%.
The bifurcation could limit the stock market's short-term upside. "Take profits in extended names in the material, industrial and energy sectors and hold the cash," Worth says. "Don't redeploy into the beaten-down groups. There will be time enough to get in" when it's clear they aren't headed lower.