Yen
Daily Chart
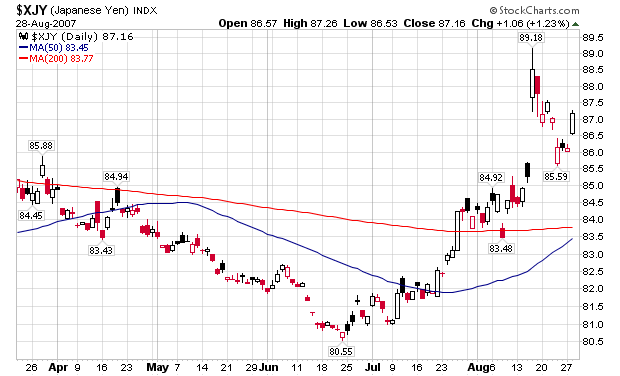
The yen spiked higher then sold-off. The post-spike sell-off is a standard move in the markets.
Here's the weekly chart.
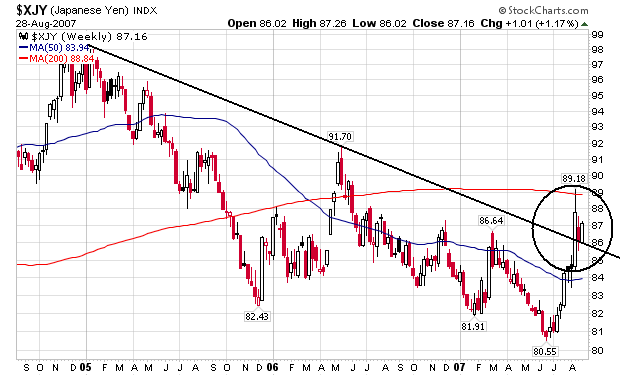
In the circled area note the following.
1.) Prices broke above long-term resistance.
2.) Prices fell back to long-term resistance.
3.) Prices rose from long-term resistance a second time.
Because the carry-trade is so important to finance right now a continued move above the resistance line is very important to watch.
T-Bill
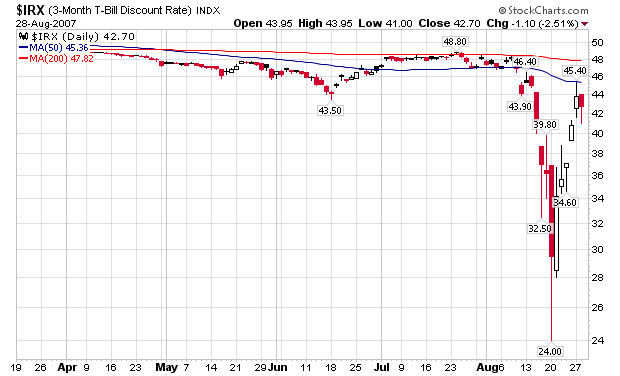
T-Bill yields have retreated from their highs at the start of the credit market problems. While they haven't returned to the previous levels, pressure is easing in this part of the credit market for now.