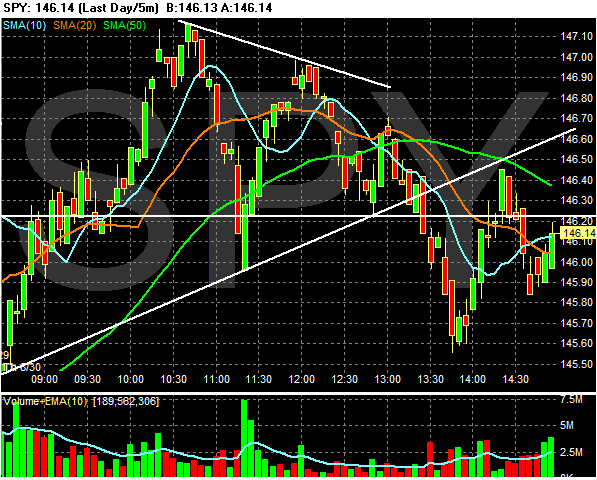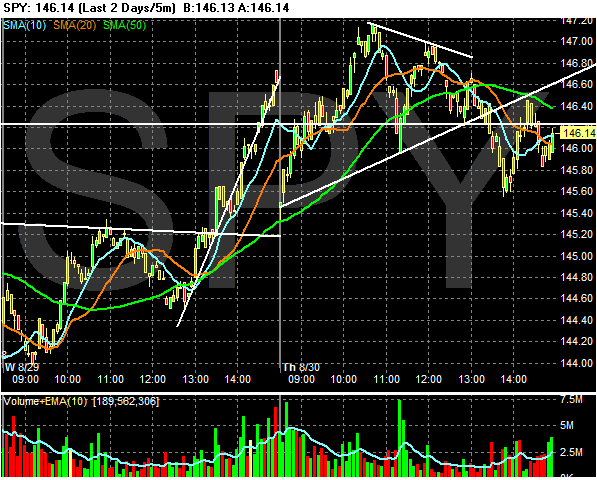
The two day chart shows the opening drop more clearly. It also shows that today's action can be seen just as much as a sideways move as a move lower.

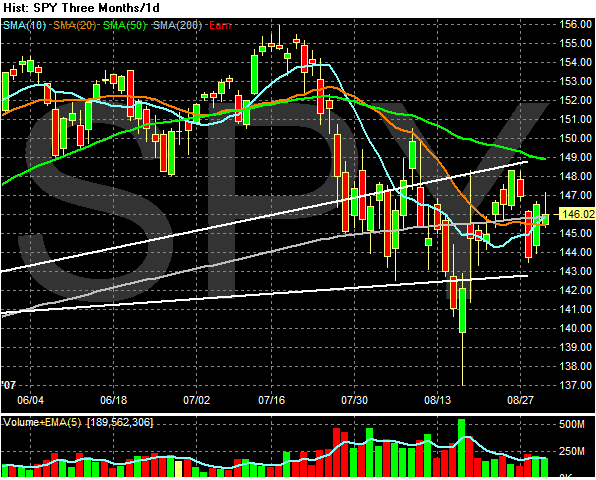
On the daily chart, we're still hugging the 200 day SMA. However, the price action over the last few days should give bulls some hope as the index did not follow though on its sell-off from two days ago.

Overall, this is still a market looking for direction. There is an even split between the bulls and the bears right now and it's keeping the market from moving in either direction.