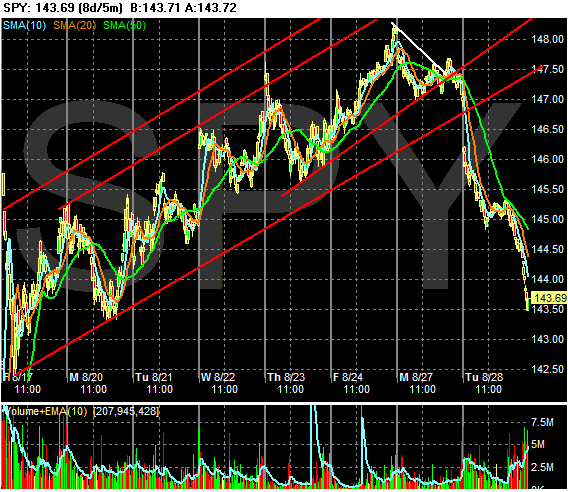
Ever since the Fed cut the discount rate, I have been talking about an upward sloping channel for the SPYs. The index broke that channel today in a big way. Here's the 8-day, 5-minute chart to illustrate.
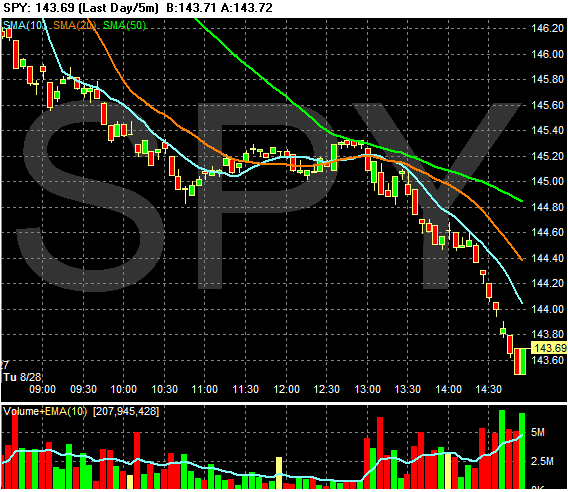
Here's the chart from today. There was one direction -- down. Notice the big pick-up in volume on the second downward sloping line -- the one that occurred after the release of the Fed minutes.
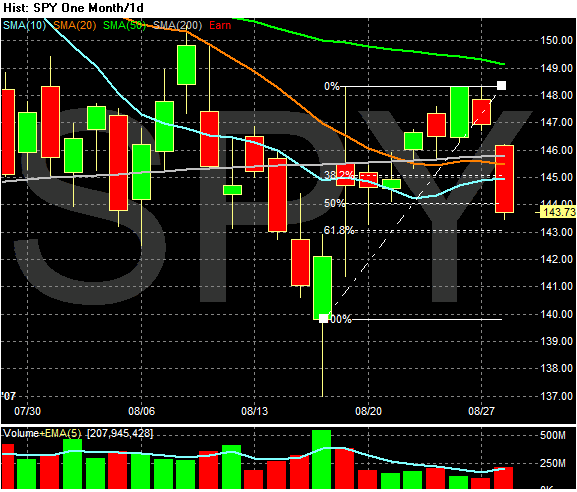
Here are two 1 month daily charts with two different Fibonacci levels. In the first chart, we're already at the 50% line of support.
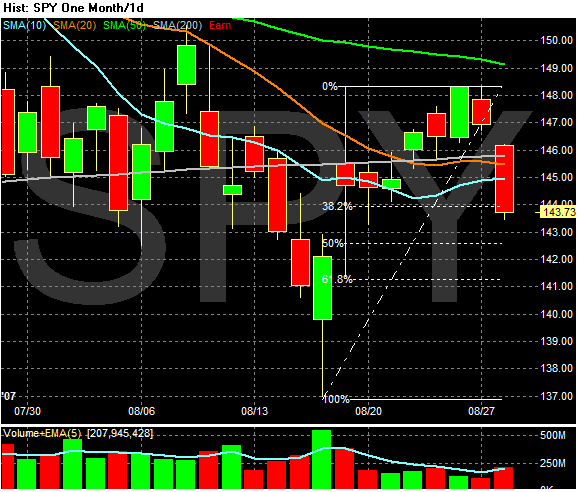
In this one we're at the 38.2% line of support
Finally, here is the 3-month daily chart. Notice we are again through the 200 day SMA, which is a bearish sign.
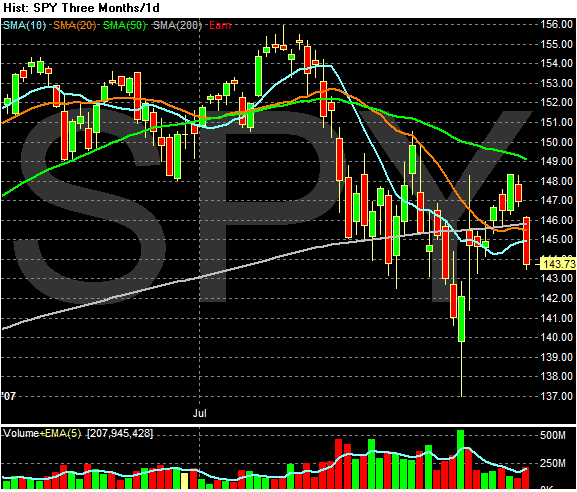
There has been a lot of talk about what the market would do after it's recent post-discount rate cut rally. My guess is we're looking at a double bottom of sorts What is crucial is where the market stops selling and the volume that occurs at that level.