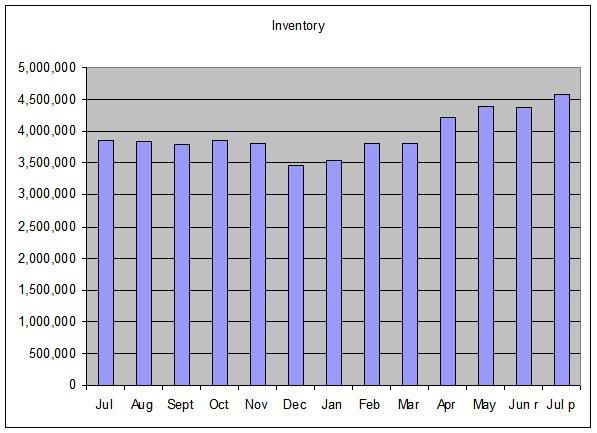
Inventories of homes for sale jumped 5.1% to 4.59 million, or about 9.6 months of supply at the current sales pace. A supply of about six months generally indicates a balanced market.
And the Blog Interest Rate Roundup noted:
It's also the highest level on record
So -- here's the graph.
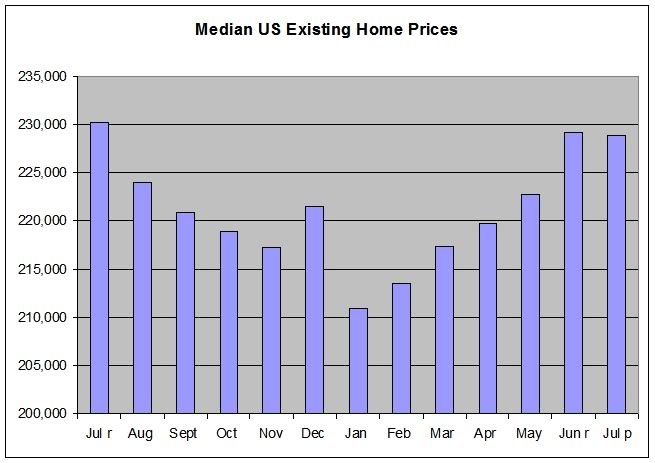
From the same report we have the following two graphs.
Median sales price:
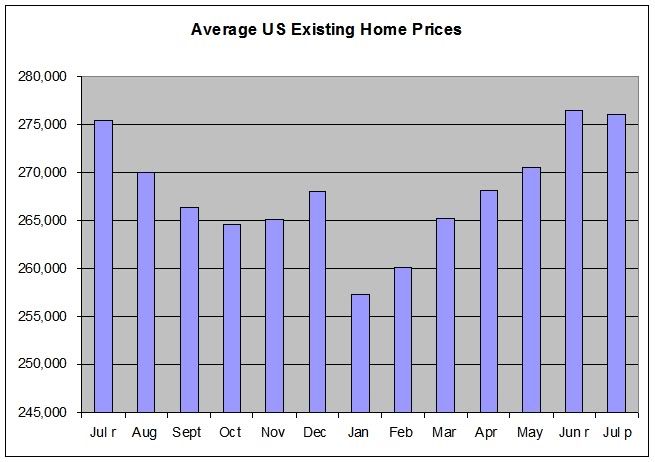
Average sales price:
Now -- look at those three graphs and notice the following.
1.) Inventory has increased over the last 6 months and is now at the highest absolute level of record.
2.) Over the same period the average and median price increase as well.
Econ 101: excess supply (which we have in spades) + decreased supply (tightening mortgage standards) = lower prices.
We aren't anywhere near a bottom yet.