The Bonddad Blog
Still nerdy after all these years
Wednesday, March 28, 2007
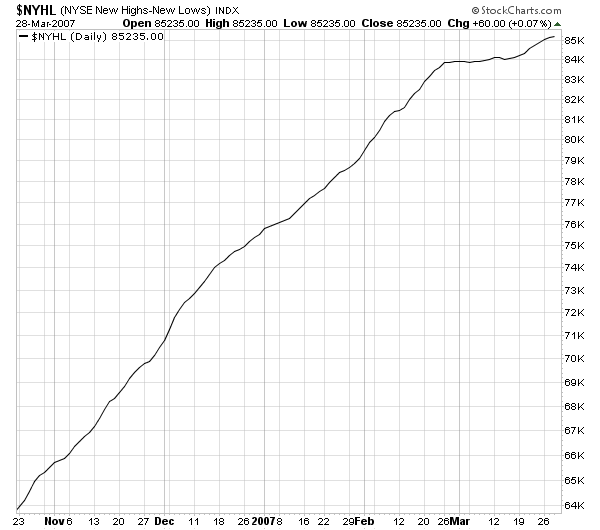
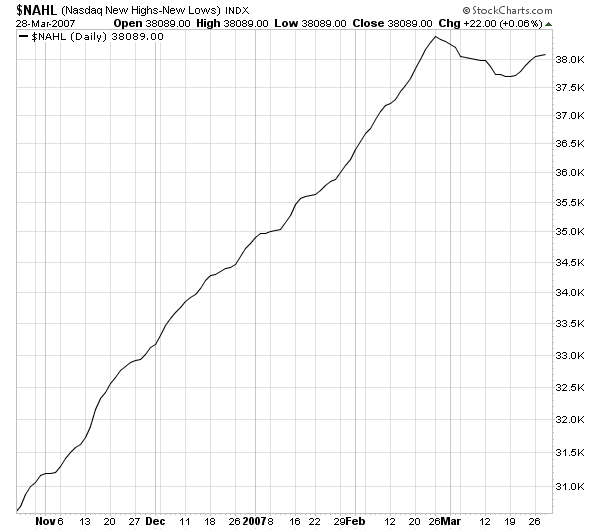
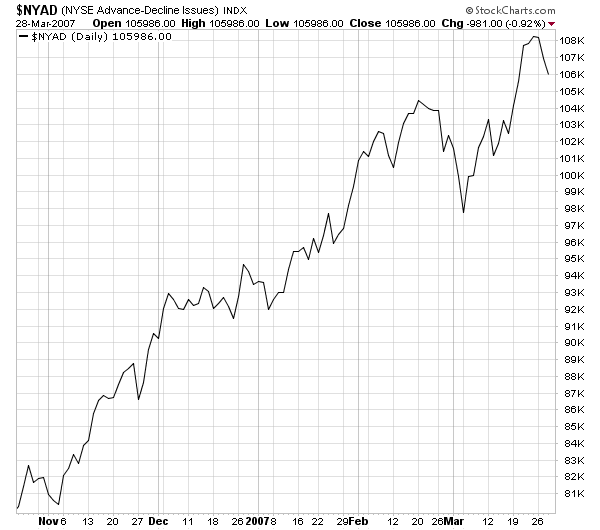
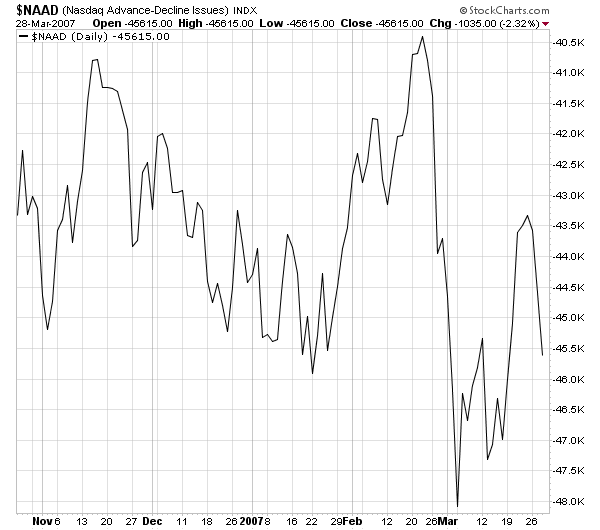
Market Breadth Turning Neutral
These charts are from Stockcharts. They show a market that is moving away from a bullish sentiment.
Fewer new highs means there is less of an upward pull in trading.
A moderating advance/decline line also means a moving away from bullish sentiment.
Newer Post
Older Post
Home