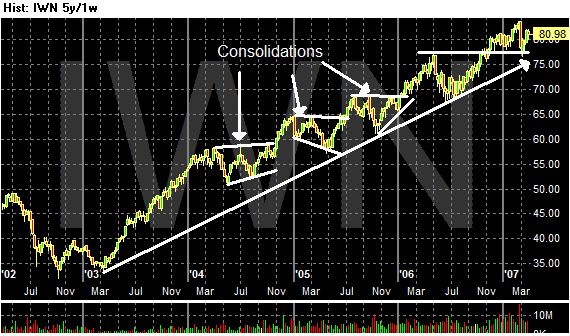
Of the three averages I track (IWN, QQQQ, and SPY), the IWNs have the most bullish chart. It's a simple 5-year rally with various consolidations along the way.

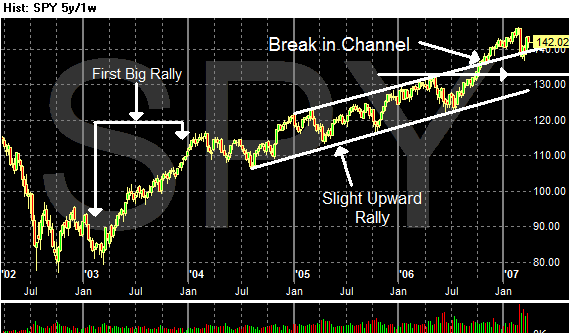
The SPYs had a strong rally in 2003. They sold-off in the first half of 2004. Then they entered a slightly upwardly biased pattern for the next two years. Here's the key: they broke through resistance, rallied, then fell back and slightly through resistance earlier this year. Now they have rallied from those levels.
This is still a fairly bullish chart, although all systems are not go. If the chart falls back through the upper channel line the overall 5-year rally could be in trouble. But the chart would still be within the channel started in mid-2004. If the average approaches the lower channel line, get a bit worried.

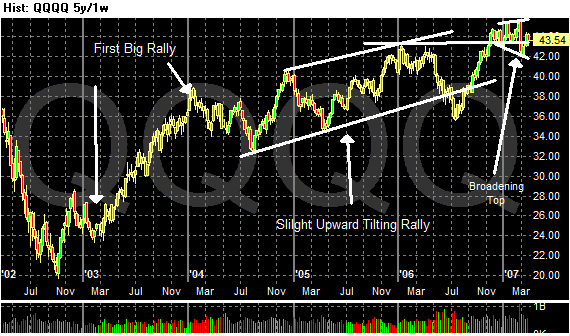
The QQQQs have a similar chart to the SPYs, although there is one key difference. They are currently forming a broadening top that is within the upper-channel line. In addition, the average is bouncing on top of support from a high set in early 2006.
However, if the average breaks below this trend line it will still be within the channel that started in mid-2004. Bulls should worry if and when the QQQQs start to approach the lower channel line.
