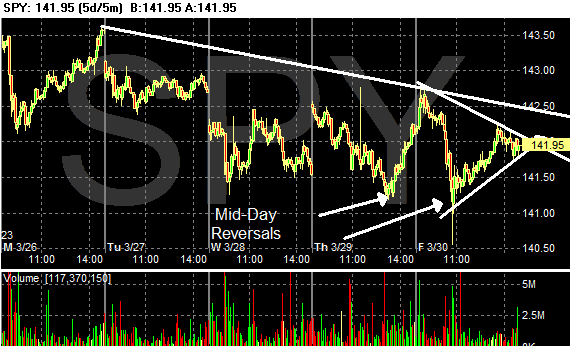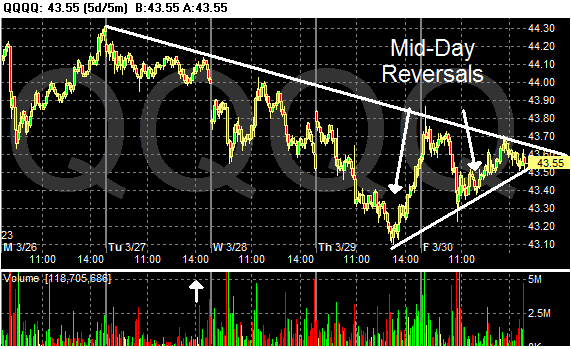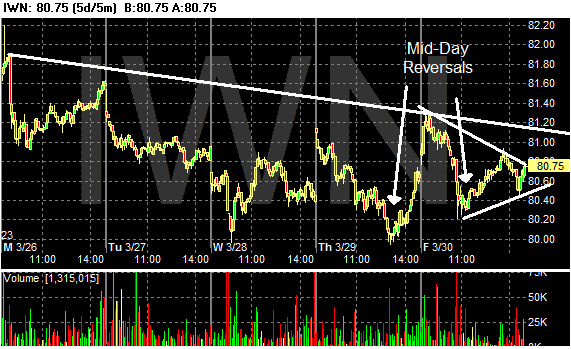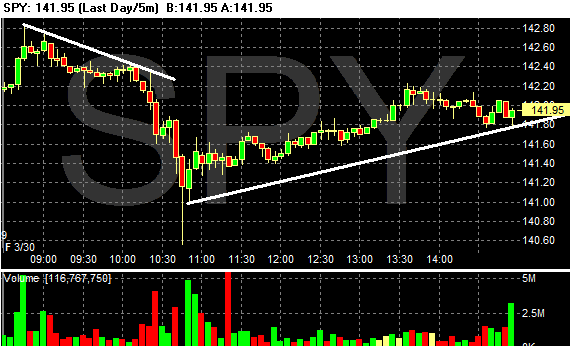
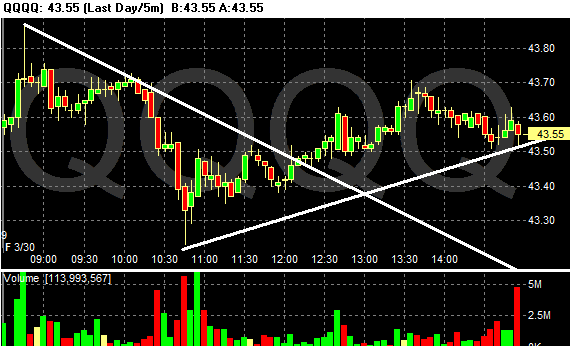
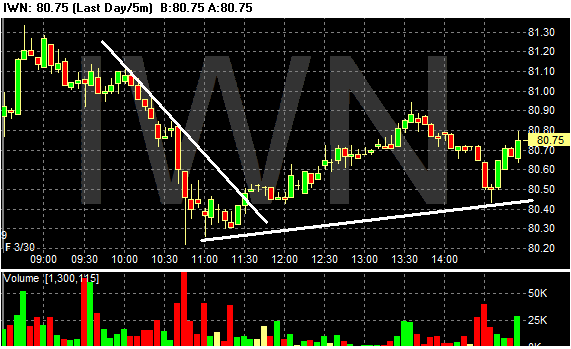
First, here are today's charts. They look very similar to yesterday's chart because -- once again -- we had a change in momentum during the trading day. Mid-day reversals are considered bullish because they indicate there is enough bullish sentiment in the markets to change direction -- to halt a downtrend.
Looking at the charts for the week, you'll notice a slight downward bias, with the QQQQs being the most pronounced. However, also notice that each average ended the day in a triangle consolidation pattern for the day. That implies there could be strong price action at the beginning of the week.