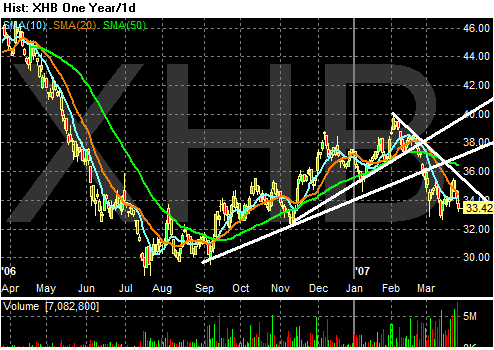
Here's the yearly chart. Like the rest of the market, this sector rallied starting in September of last year. However, in late February the sector broke the upward trend line and fell below the 10, 20 and 50 day SMA. The index lost about 10%. It is currently consolidating its losses in a bear market wedge pattern.

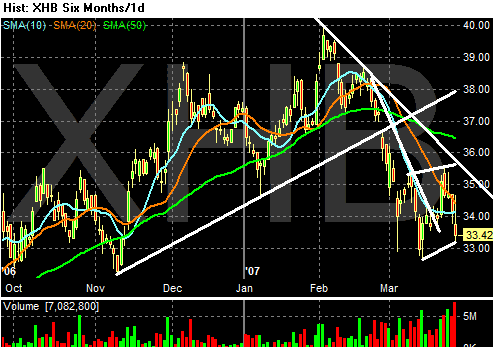
Here's a look at the 6 month chart, which betters shows the clear upward trend break.

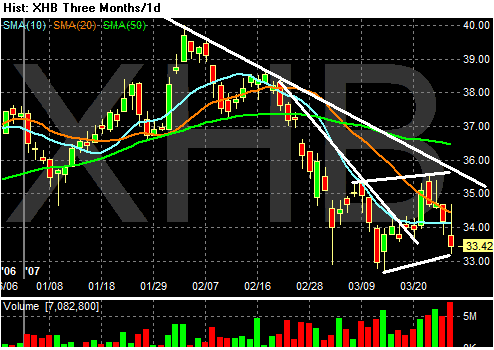
On the three month chart notice a few things.
1.) There are actually two downtrends in place. While recent action has broken the latest, steeper trend, the secondary trend is still firmly in place.
2.) The last 4 bars of downward price action have been on increasing volume. This may indicate selling pressure is increasing.
3.) We're near a low price, meaning a move and close below say $32.75 would be a bearish signal.
