Tuesday, March 27, 2007

The Markets Today

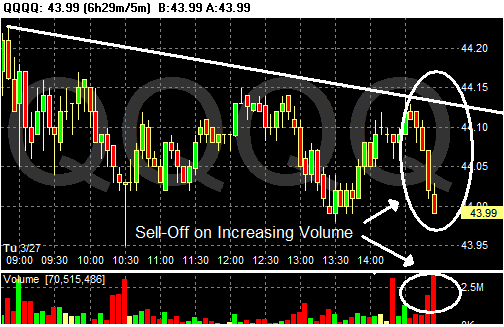
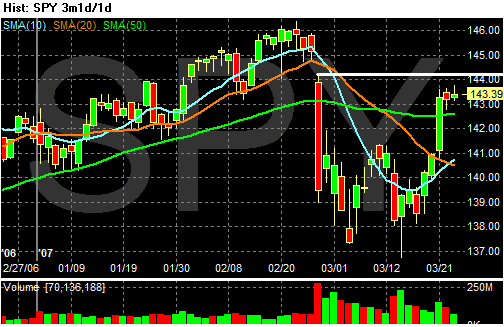
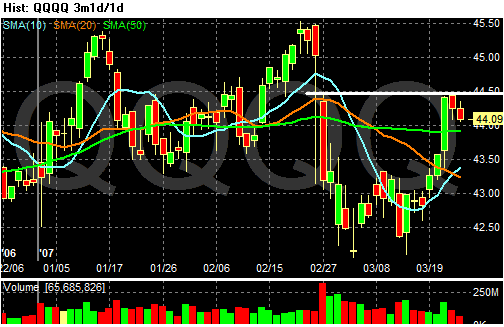
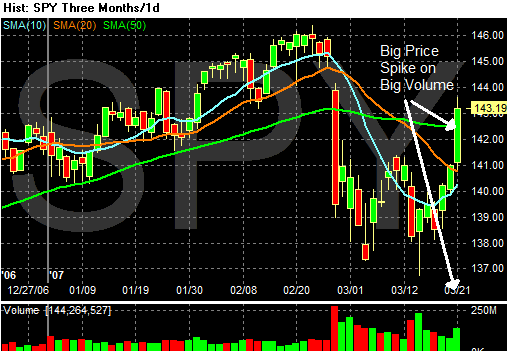
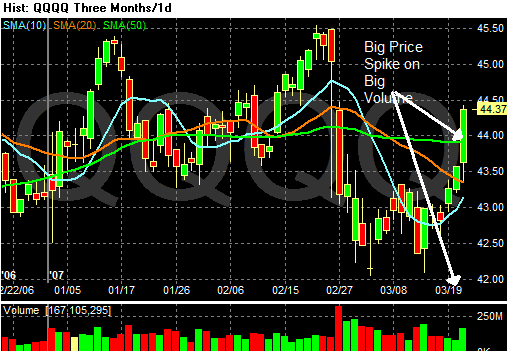
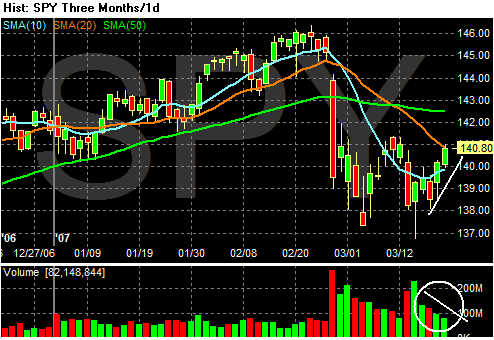
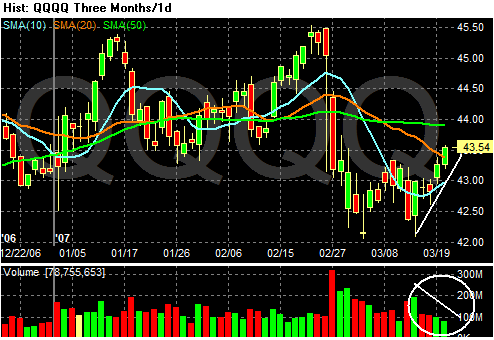
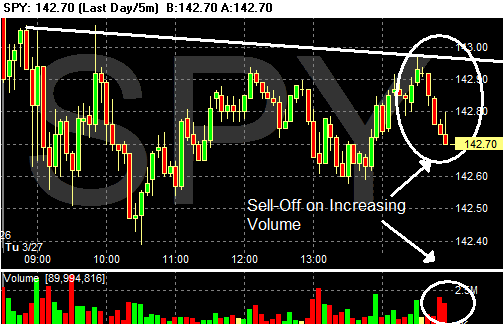
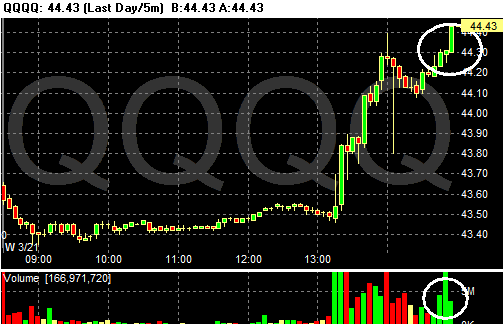
All of the markets have a downward bias today. They all opened lower and zig-zagged a bit. However, pay particular attention to the SPYs and QQQQs end of the day action. They both sold-off on heavy volume. This is never a good sign because it indicates traders saw something that led them to want to get out of the market. The QQQQs ended the day at their low point.

Photo Sharing and Video Hosting at Photobucket

Photo Sharing and Video Hosting at Photobucket

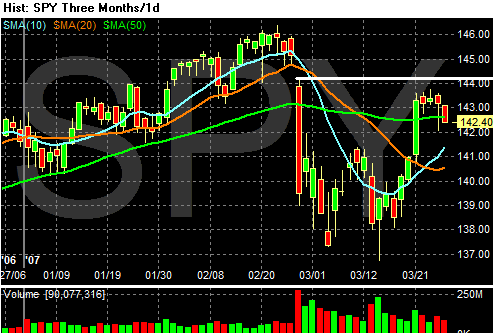
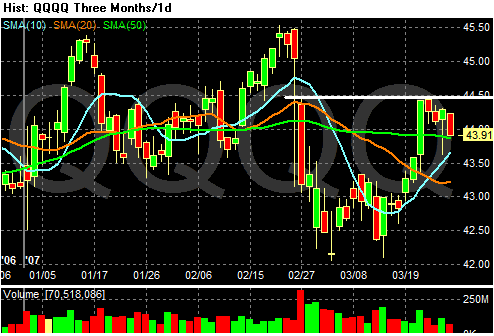
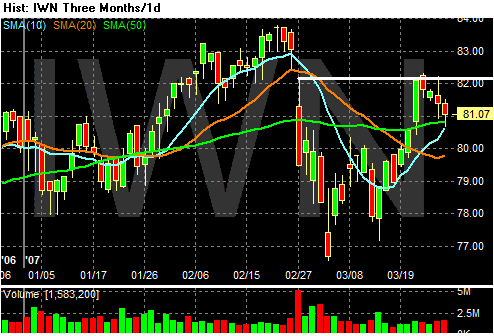
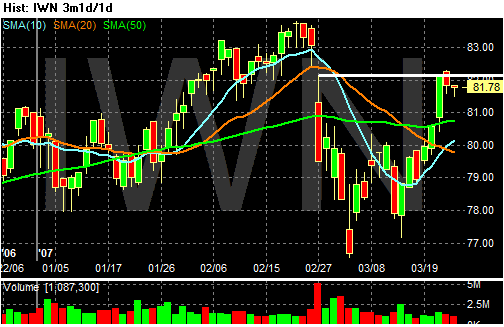
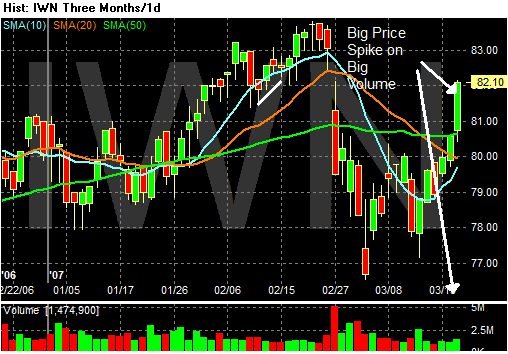
Looking at the daily chart, notice none of the averages has closed above the drawn resistance lines from the sell-off a few weeks ago. Something is keeping the markets from advancing above these points. However, the price action for the last few days could be considered a standard pull-back during a rally. In other words, the fact the markets haven't sold-off is also important. This qualifies as a "we'll have to wait and see" how it all shakes out.

Photo Sharing and Video Hosting at Photobucket

Photo Sharing and Video Hosting at Photobucket

Photo Sharing and Video Hosting at Photobucket

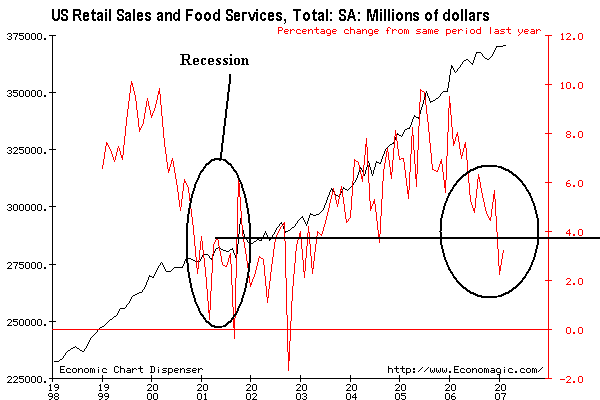
How Confident Are Consumers?

Here is a chart of the Year-over-year change in retail sales. The figures aren't adjusted for inflation, but are adjusted for seasonal factors.

Photo Sharing and Video Hosting at Photobucket

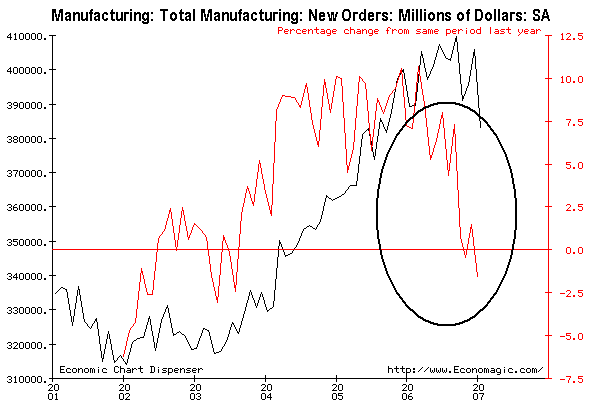
How Confident is Business?

Business is ordering less and less new "stuff". Here is a chart of new orders, seasonally adjusted. The black line is total orders. The red line is the percentage change from year ago levels.

Photo Sharing and Video Hosting at Photobucket

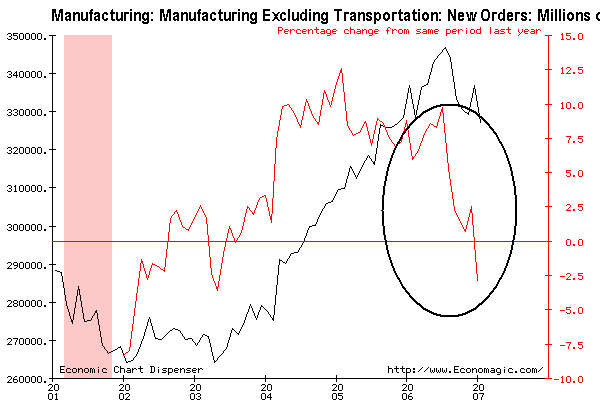
Transportation orders can really skew these numbers, so let's take them out of the graph. The same color scheme applies:

Photo Sharing and Video Hosting at Photobucket

Oil Refineries Are Breaking Down With More Frequency

From the LA Times:

Refineries across the country are breaking down with unusual frequency this year, boosting prices at the pump and endangering workers and communities.

The rash of oil plant problems may not be a coincidence. The breakdowns stem from the hard use of aging equipment, a shortage of trained workers, corporate cost-cutting and ownership changes, refinery experts say.

In the first six weeks of 2007, there were 43 incidents involving pipeline leaks, chemical releases, plant breakdowns and fires, more than has been typical, Kim Nibarger, a safety expert for the United Steelworkers Union, told Congress during a hearing last week on refinery safety.


If it continues, this will only add upward pressures on gas prices.

Lennar Earnings Drop

From Bloomberg:

Lennar Corp., the largest U.S. homebuilder by revenue, said earnings plummeted 73 percent in the fiscal first-quarter as demand waned in the worst housing slump in more than a decade.

Net income for the three months ended Feb. 28 declined to $68.6 million, or 43 cents a share, from $258.1 million, or $1.58, a year earlier, the Miami-based company said today in a statement. Lennar said it will likely miss its 2007 profit forecast as the normally stronger spring selling season had not materialized.

``Given the state of the market, we do not expect to achieve our previously stated 2007 profit goal,'' Chief Executive Officer Stuart Miller said in the statement. ``We are not comfortable providing a new earnings goal at this time.''


Pay particular attention to what the CEO said:

``The housing market continues to demonstrate overall weakness,'' Miller said in today's statement. ``While some markets are performing better than others, the typically stronger spring selling season has not yet materialized. These soft market conditions have been exacerbated by the well-publicized problems in the subprime lending market.''


When industry insiders stop spinning and start using words like "weakness" and "the typical stronger spring selling season has not materialized", you know two things.

1.) It's an accurate statement. CEOs as paid to make positive public statements to support the company and the industry.

2.) Things are pretty damn bad to force that level of straight talk.

Gasoline Futures Hit 7-Month High

From IBD:

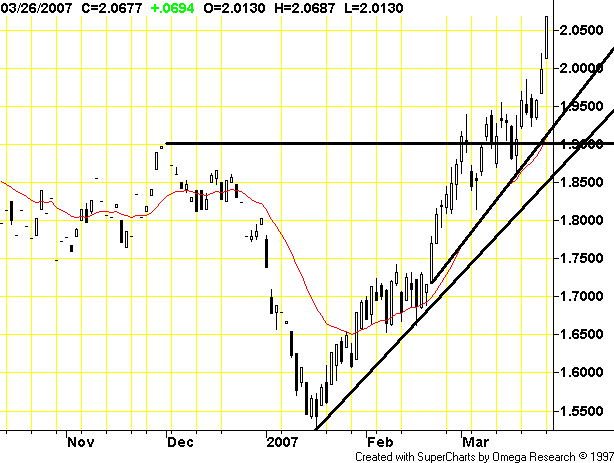
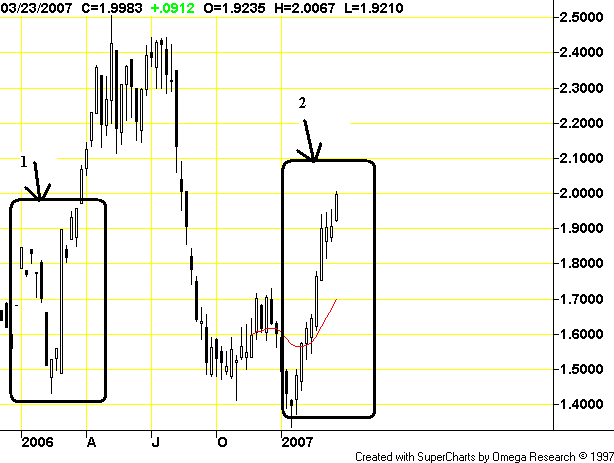
April gasoline rose 6.94 cents to $2.0677 a gallon, its highest since Aug. A BP refinery in Indiana is running below pace after a small fire there, reports say. That's the latest in a slew of refinery woes. Crude rose 63 cents to $62.91, a 3-month high amid rising tensions with Iran, OPEC's No. 2 producer. Retail gas prices are up 42 cents in the last 7 weeks to $2.655 a gallon.


Here's a daily chart of gasoline prices.

Photo Sharing and Video Hosting at Photobucket

While that chart looks like prices are out of control, notice in the chart below the seasonality of gas prices. Gas prices this year (denoted as #2) are more or less following the same pattern as last year (denoted as #1). Gas prices typically spike in the summer.

Photo Sharing and Video Hosting at Photobucket

Monday, March 26, 2007

New Home Inventory in Perspective

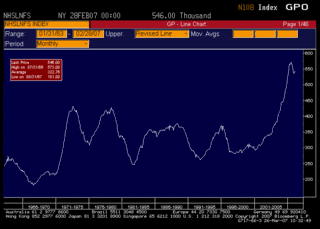
This graph is from Interest rate roundup a great blog that everybody should read. Not only does it make me miss a Bloomberg terminal, it also shows just how out-of-whack the current inventory level is with historical norms.

I resized the chart. It goes back to 1963.

Photo Sharing and Video Hosting at Photobucket

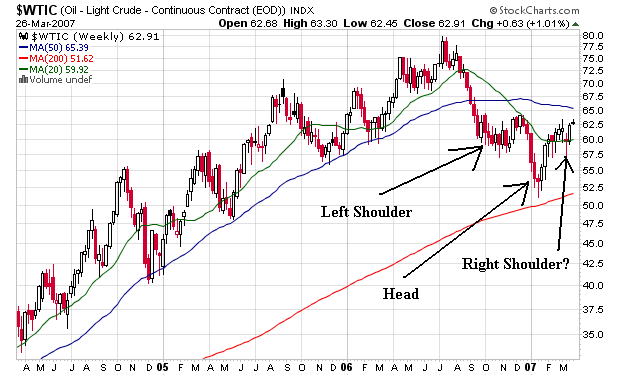
Is the Oil Weekly Chart Forming an Upside-Down Head and Shoulders Pattern?

Photo Sharing and Video Hosting at Photobucket


If it is, then the last 4-6 months have been a consolidation, and a move above the neckline would indicate a possible bull run --- just in time for the summer driving season.

Food for thought....

Oil Prices Set Yearly High

From Yahoo News:

Oil prices settled Monday at their highest level so far this year on tensions between Iran and the West following Tehran's detention of British naval personnel. Gasoline futures prices climbed above $2 a gallon to their highest level since last September as a new driving season nears.

Oil traders worried that an escalation in the conflict could cut Persian Gulf oil exports.

On the New York Mercantile Exchange, light, sweet crude for May delivery rose 63 cents to settle at $62.91 a barrel, the highest settlement for the front-month contract since Dec. 20. Earlier, the contract rose as high as $63.30 a barrel.


Oh to be a Central Banker now that inflationary pressures are increasing during an economic slowdown....

Markets Stage an Impressive Rally

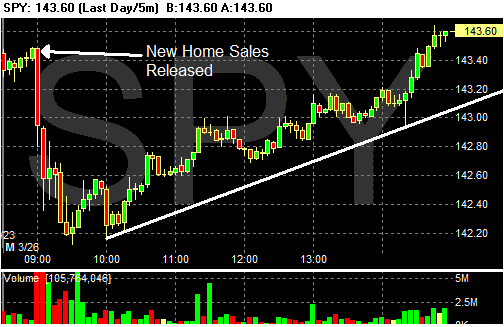
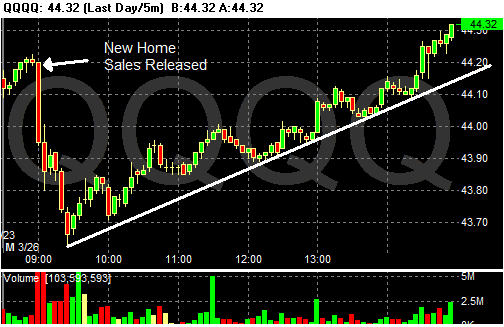
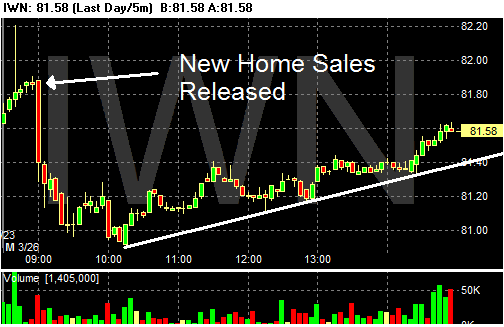
The charts say it all. The SPYs, QQQQs and IWNs all tanked after the new home sales reports. But all three staged an impressive recovery throughout the rest of the day. All three have what is called a "bump and run" formation, meaning all three markets had an upward sloping trend line which acted as support for the entire rally.

In addition, the SPYs and QQQQs all closed at/near their daily highs on a good volume spike.

This was a solid bull-based performance for the averages. In conjunction with last week's performance, it looks like the bulls are in charge -- at least for now.

Photo Sharing and Video Hosting at Photobucket

Photo Sharing and Video Hosting at Photobucket

Photo Sharing and Video Hosting at Photobucket

More on New Home Sales

Welcome to Taylor Marsh Readers

Welcome to the Left Coaster Readers

From Bloomberg:

The supply of unsold homes climbed to the highest in 16 years, the Commerce Department said in Washington today. Purchases dropped 3.9 percent to an annual pace of 848,000 last month. Economists had forecast they would rise to a 985,000 rate, based on the median forecast in a Bloomberg News survey.

.....

``As ugly as these numbers are, they don't reflect the tightening of lending standards, which means sales are going to get worse,'' said Christopher Low, chief economist at FTN Financial in New York. ``The longer it takes for housing to recover, the more the risk it could spill over to other parts of the economy.''


From CBS:

Inventories of unsold homes rose 1.5% to 546,000, representing an 8.1-month supply, the largest inventory in relation to sales since January 1991, at the tail end of a recession. The inventory is up 27% in the past 12 months.

Inventories are probably understated, however, because they don't include homes thrown back on the market due to buyer cancellations

Record backlogs

The number of completed but unsold homes rose to a record 179,000 in February from 177,000, up 43% from a year earlier.

"There is an enormous backlog of unsold new homes that have to be worked off before builders will start building spec homes," wrote Ray Stone, chief economist for Stone & McCarthy Research, in a research note.


Let's review the points made above.

1.) Sales are at the lowest level in 7 years

2.) Inventories are the highest they've been in 16 years -- at the tale end of a recession.

3.) Inventories are probably higher because of cancellations.

4.) Tighter lending standards -- which have been recently implemented -- aren't included in these numbers.,

5.) The number of completed and unsold homes is at a record.

None of this news points to a bottom in housing. We're not even close.

New Home Sales Drop 3.9%

Welcome to Atrios Readers.

For more information -- and some great graphs -- see Calculated Risk

First -- this report has an incredibly large confidence interval. That simply means the actual number could be plus or minus 17.4.

The information is from the Census Bureau

Sales are down 18.3% from February of last year.

There is now an 8.1 month supply of available inventory. That's a ton of homes.

The total raw inventory level has increased from 538,000 in February 2006 to 546,000 in February 2007. Remember we saw housing starts increase 9% in February. That means we've got more inventory coming onto the market. My guess is the homebuilders were expecting demand to pick-up a bit this year. These recent starts could mean the market may build an unwanted inventory glut.

The Northest and Midwest saw big drops -- 27% and 20%, respectively. The weather will be blamed for some of this. The West saw a 24.6% increase. That number doesn't make sense. I am guessing we'll see a revision of that number or the January number sometime soon.

Also remember that lending standards have tightened over the last few months. That means there will be fewer buyers going forward.

Also -- the median price increased from 243,200 to 250,000. It doesn't make sense for prices to increase in a decreasing sales market.

The bottom line is this report stinks for the housing market.

Dollar Update

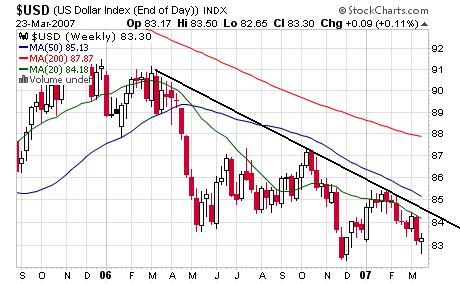
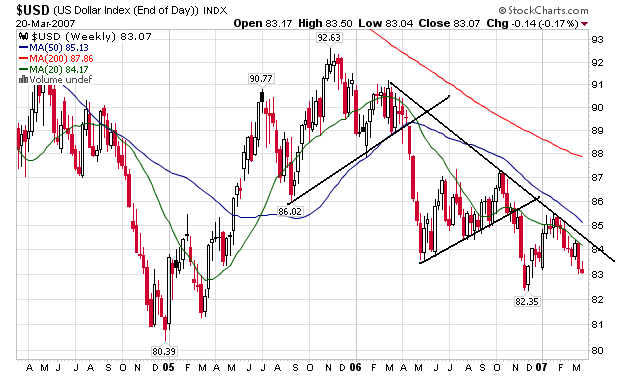
The weekly dollar chart still shows the dollar is in a bearish pattern of lower lows and lower highs. Also note

1.) The trend line is still decidedly downward and the dollar index is nowhere near breaking the trend.

2.) The 20/50/200 SMAs are all decidedly bearish as well.

It's going to take a big, fundamental change for this chart to move into bullish territory.

Photo Sharing and Video Hosting at Photobucket

Foreclosures Still Increasing

From Bloomberg:

U.S. homeowners are falling behind on their payments 33 percent faster than they did last year, according to a report by California-based RealtyTrac, which researches data on Americans entering the foreclosure process.

In February, foreclosure proceedings -- from default notices for late payment to auctions and repossessions -- rose 12 percent from a year earlier, affecting 130,786 properties, or one in every 884 U.S. households, RealtyTrac said.

Falling or little-changed home prices are making it difficult for homeowners to sell or get new mortgages on homes they bought or refinanced with adjustable-rate mortgages.


It's important to note that we're still in an economic expansion, albeit a slower one. That means if we hit a recession, we're in for some scarier numbers.

OPEC Production Cuts Reduce Output By 1 Million Barrels/Day

From Bloomberg:

Saudi Arabia is shipping less oil to customers. OPEC by February reduced daily output by 1 million barrels. Global inventories this year fell the most in a decade.

Credit Ali al-Naimi, oil minister of Saudi Arabia, the world's largest exporter, who told OPEC members that production cuts would stop a six-month decline in oil. Crude this year rebounded 26 percent from a 20-month low to $62.81 a barrel.

``We are happy with the level of compliance,'' Mohamed al- Hamli, president of the Organization of Petroleum Exporting Countries, said in an interview in Bangkok on March 22.


Oil has bounced around between roughly $57 - $62/barrel for the last few months. OPEC's production cuts should help to provide a floor for prices going forward.

The decline in inventories is also providing a floor for oil prices.

This is not good news for the Federal Reserve who are caught between stubbornly persistent inflationary pressures (in part caused by commodity prices) and slower growth.

A Quick Review of Last Week

From IBD:

The Nasdaq ramped up 3.2% for the week. That was the tech-laden composite's best return since a 3.2% surge during the week ended Sept. 15 of last year.

The S&P 500 bounced 3.5% for the week. The Dow leapt 3.1%, while the S&P 600 vaulted 4.1%


Here's a link to the charts.

Sunday, March 25, 2007

Agricultural Prices Still At Dangerous Levels

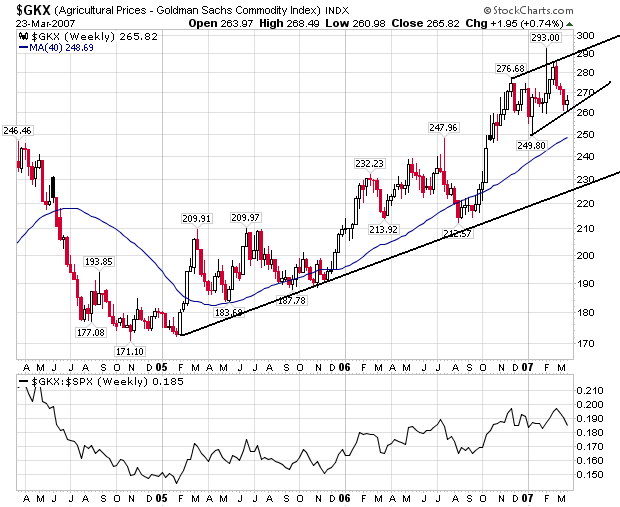
Here is a chart of agricultural futures. Remember that in both CPI and PPI, agricultural prices have been spiking for the last three months. In conjunction with oil prices, these price increases may be large enough to keep the Federal Reserve on hold for an interest rate cut unless the economy really tanks.

Photo Sharing and Video Hosting at Photobucket

Oil Prices Making a Comeback

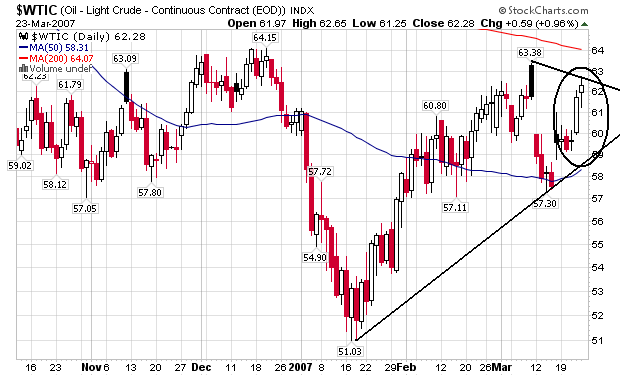
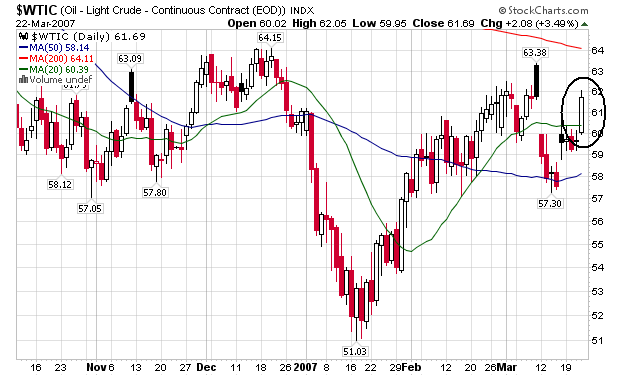
Here is a daily chart of oil prices:

Photo Sharing and Video Hosting at Photobucket

Last week's price action is circled. Notice the big jump in prices after the Iranians captured 15 British sailors. Oil's sensitivity to geopolitical issues will continue to be a huge Achilles heal.

The Week Ahead

New home sales come out on Monday. Pay particular attention to the inventory levels -- especially the raw numbers. The total available inventory increased 2.68% from January 2006 - 2007, from 522,000 to 536,000. It's going to be awhile before the big drop in new home construction starts to decrease this inventory.

Bernanke speaks on Wednesday and Friday. Pay very close attention to what he says about inflation. His speeches are available online at the Federal Reserve site.

The final 4th quarter GDP number comes out on Thursday. So long as the number doesn't jump around this won't be that important.

We also get durable goods and NAPM numbers on Wednesday and Friday, respectively.

Saturday, March 24, 2007

Saturday = Day Off

Going to a local art festival with my girlfriend. She's the only person who can get me away from the markets.

Back sometime tomorrow.

Friday, March 23, 2007

The Market's Last Week

Let's take a look at the charts to see what happened last week

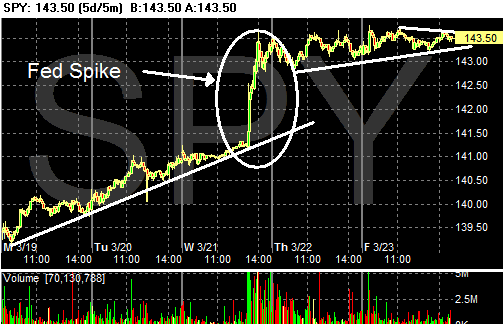
The SPYS had a nice upward bias through mid-Wednesday. They spiked after the Fed announcement then consolidated for the rest of the week.

Photo Sharing and Video Hosting at Photobucket

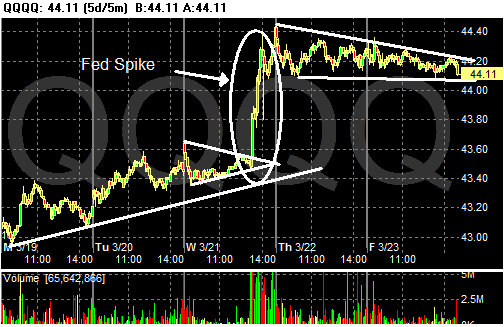
The QQQQs rose a a bit until mid-Tuesday when they consolidated their gains. Then they spiked after the Fed announcement and consolidated for the rest of the week.

Photo Sharing and Video Hosting at Photobucket

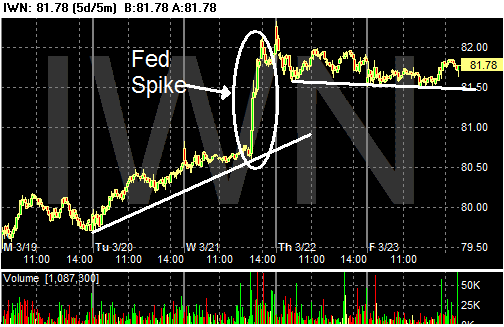
The IWNs rallied from Tuesday morning until the Fed announcement, then rallied hard on the rate announcement. Like the other two averages, they consolidated gains for the rest of the week.

Photo Sharing and Video Hosting at Photobucket

All three charts are solid charts going forward -- all three have strong upward momentum.

Looking at all three charts from the daily perspective, all three closed the week out below important resistance levels. If the markets want to continue higher they will have to cross and cloase above these levels.

Photo Sharing and Video Hosting at Photobucket

Photo Sharing and Video Hosting at Photobucket

Photo Sharing and Video Hosting at Photobucket

Existing Home Sales Increase Most in three Years

From Bloomberg:

Sales of previously owned homes in the U.S. unexpectedly rose in February at the fastest pace in three years, a sign the housing market is still recovering even as lending standards tighten.

Purchases increased 3.9 percent last month to an annual rate of 6.69 million, from 6.44 million in January, the National Association of Realtors said today in Washington. Sales were down 3.6 percent from a year earlier.

The report, together with a gain in February housing starts reported this week, bolsters the view that housing will gradually stop being a drag on economic growth. Falling prices and low borrowing costs are supporting demand, easing concern that defaults on subprime mortgages will worsen the glut of homes, economists said.


Steady interest rates were a reason for the increase:

According to Freddie Mac, the national average commitment rate for a 30-year, conventional, fixed-rate mortgage was 6.16 percent in the last week, down from an average of 6.29 percent in February. The 30-year fixed was 6.22 percent in January, and 6.25 percent in February 2006.


OK -- now the bad news:

The national median existing-home price2 for all housing types was $212,800 in February, down 1.3 percent from February 2006 when the median was $215,700. The median is a typical market price where half of the homes sold for more and half sold for less.

...

Total housing inventory levels rose 5.9 percent at the end of February to 3.75 million existing homes available for sale, which represents a 6.7-month supply at the current sales pace compared with a 6.6-month supply in January. Raw inventories peaked last July at 3.86 million, and supplies topped at 7.4 months in October.


To sum up, sales increased because prices are dropping. But inventory levels are still increasing. Also note that from a raw, total numbers perspective, the total number of existing homes on the market has only dropped 2.84% since July of last year. That means sales haven't really made a huge dent in the inventory on the market. While the market is never "cleared", it should come down a bit more than it has.

Going forward prices will probably have to drop more to clear the market.

How Widespread are Subprime Problems?

Pretty far. From the WSJ (subscription required):

Far from being limited to the subprime market, the data show these risky loan features have become widespread. According to Credit Suisse, the number of no or low documentation loans -- so-called "liar loans" -- has increased to 49% last year from 18% of purchase loans in 2001, a nearly three-fold increase. The investment bank also found that borrowers put up less than a 5% down payment in 46% of all home purchases last year. Inside Mortgage Finance estimates that nontraditional mortgages -- mostly interest-only and pay-option ARMs that allow the borrower to defer paying back principal or even increase the loan balance each month -- which barely existed five years ago, grew to close to a third of all mortgages last year.

The Alt-A market, a middle ground between subprime and prime, has increased seven-fold since 2001 and accounted for 20% of home-purchase loans last year. Fully 81% of Alt-A loans last year were no or low documentation loans, according to First American Loan Performance. Why have borrowers employed this kind of risky financing? Because it was the only way many of them could afford a home in some of the hottest housing markets, where prices more than doubled in five years.

Oil Prices Jump

From IBD:

Near-month oil futures shot up on fuel supply fear a day after gov't data showed another big drop in gasoline and heating oil stockpiles. The Fed's near-neutral bias Wed. raised hopes for stronger U.S. growth and energy demand. April RBOB gasoline rose 2.26 cents to $1.9575 a gallon, near Tues.' 7-month high. High gas prices could hit ailing U.S. consumers.


There's more:

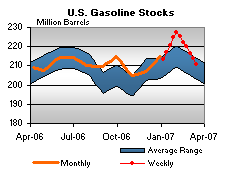
Nationwide prices rose 1.8 cents last week to $2.577 a gallon. That's 7 cents higher than a year ago. U.S. gas prices have surged more than 36 cents in the past six weeks.

Demand was up while supplies of both gasoline and crude oil remained below year-ago levels.

Refineries are at capacity and gasoline imports are down. Gas futures are at their highest since August — suggesting retail prices have further to go.

"You put it all together and it's just very bullish for gasoline prices," said Phil Flynn, an energy analyst at Alaron Trading. "Don't expect these problems to go away."


Here's why.

Oil inventories are lower now than they were at this time last year:

Photo Sharing and Video Hosting at Photobucket

And gas inventories are dropping fast and hard:

Photo Sharing and Video Hosting at Photobucket

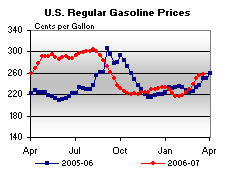
As a result, gas prices are increasing:

Photo Sharing and Video Hosting at Photobucket

This is why the daily oil chart spiked yesterday:

Photo Sharing and Video Hosting at Photobucket

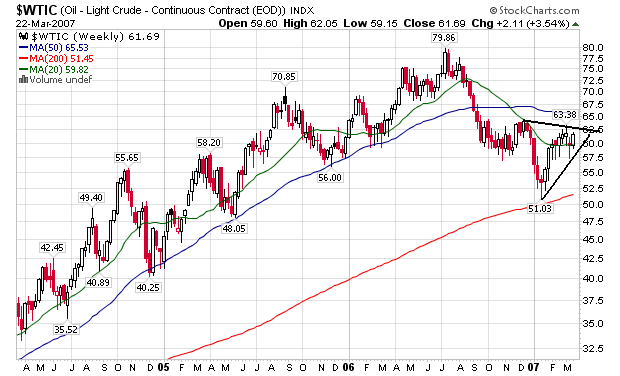
From a longer term perspective, oil prices appear to be consolidating in a triangle pattern:

Photo Sharing and Video Hosting at Photobucket

I bet the Federal Reserve is not happy about this development....

Some of these charts are from the Department of Energy's This Week in Petroleum

Thursday, March 22, 2007

Countrywide Executives Dumping Stock

From the Street:

Insiders at Countrywide, the nation's largest mortgage lender, have sold $314 million worth of shares in the company just since August. That's according to regulatory filings tracked by Interactive Data Corporation.

The sales include a staggering $94.5 million by chief executive Angelo Mozilo, and $17.5 million by mortgage division chief David Sambol.


That gives me a tremendous feeling of confidence.

Countrywide Financial: 2006 Defaults Could Set a Record

From CNBC:

"We believe that declining home prices and other factors ... may produce foreclosures numbers on 2006 originations approaching or exceeding those on loans originated in 2000," Samuels said in remarks.


Just what the housing market needed to hear....

Gas Prices Are Still Rising

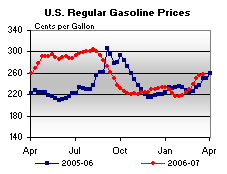
From This Week in Petroleum:

Photo Sharing and Video Hosting at Photobucket

Gasoline prices were up for the seventh consecutive week, increasing 1.8 cents to 257.7 cents per gallon as of March 19, 2007. Prices are now 7.3 cents per gallon higher than at this time last year. All regions reported price increases. East Coast prices were up 2.0 cents to 255.3 cents per gallon, while Midwest prices rose 0.3 cent to 249.0 cents per gallon. Prices for the Gulf Coast were up 1.6 cents to 241.8 cents per gallon. The largest regional increase was in the Rocky Mountains, where prices increased 9.0 cents to 250.2 cents per gallon. West Coast prices were up 2.6 cents to 294.6 cents per gallon, with the average price for regular grade in California up 1.0 cent to 307.8 cents per gallon, 44.3 cents per gallon above last year’s price.


Last year we had $3/gallon prices in some areas of the country. This price level caused a great deal of concern. While some people may be thinking the economy can withstand that level of a price shock now because we did last summer, there are some really important differences. The economy has continued at a slow pace of growth. Now consumers have seen the housing market flounder for the better part of the last year. In short, we have seen stagnant growth for a lot longer now. This might have a larger depressing effect on consumer sentiment.

The Fed is Caught Between A Rock and A Hard Place

From the AP:

"The Fed is caught right now. The inflation numbers are looking worse, but on the other hand, the economy is looking softer," said David Wyss, chief economist at Standard & Poor's in New York.

Wyss said he believed the Fed was using the statement to edge closer to cutting rates if necessary to bolster economic growth, but he said investors should not expect any change at the Fed's next meeting on May 9.

David Jones, chief economist at DMJ Advisors, a private consulting firm, said he believed the Fed would remain on hold probably until September.

"The Fed is facing a standoff. The economy is slowing and inflation is getting worse," Jones said. "They have got to let the dust settle on this very mixed picture before they do anything."

Wyss said the Fed could cut rates as many as three times although he said some of those reductions might not come until next year.

Jones said he believed the Fed might be content to just cut rates once in the second half of this year if the economy is showing signs of rebounding at that time.


Let's look at the overall numbers.

GDP growth has been "below full potential". It grew at a pace of 2%, 2.6% and 2.2% in the second - fourth quarter of 2006, respectively. Housing has the big reason as it decreased 11%, 19% and 19% in the same quarters.

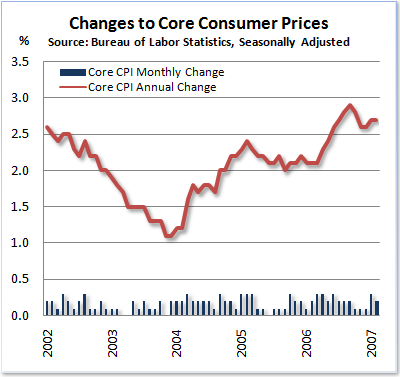
At the same time, inflation has increased. Here's a year-over-year chart of core CPI:

Photo Sharing and Video Hosting at Photobucket

Yesterday the markets were just thrilled about the possibility of a rate cut. But they forgot about inflation. Assuming all things remain the same, the Fed won't be lowering rates anytime soon.

Right now it sucks to be a Central Banker.

More On Yesterday's Markets

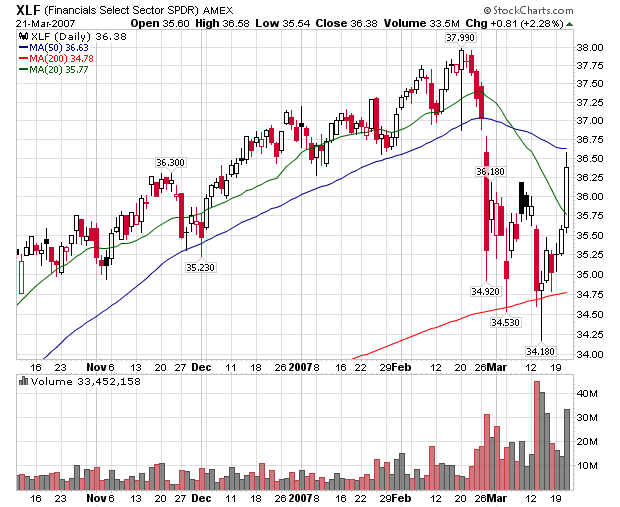
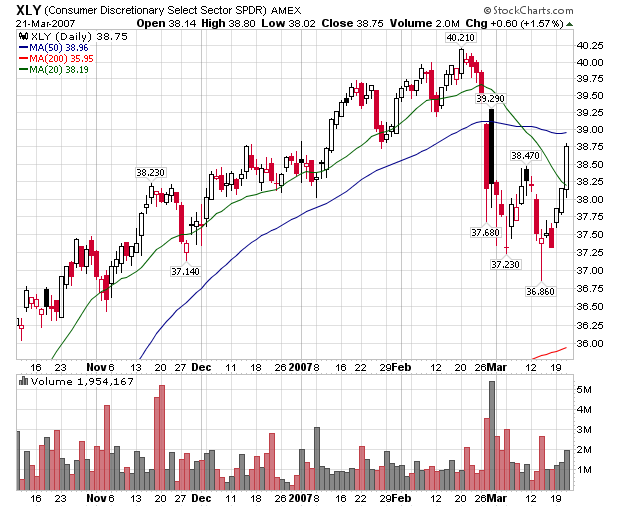
Yesterday the markets rallied after the Fed issued its policy statement. The overall averages were up on strong volume which is a bullish event. Let's look at a few of the largest market sectors to see where the real action was.

The financials did very well, mirroring the market's move with a strong bar on big volume.

Photo Sharing and Video Hosting at Photobucket

Consumer Discretionary also rose on solid volume


Photo Sharing and Video Hosting at Photobucket

While technology rose, notice the volume wasn't anywhere near as strong.

Photo Sharing and Video Hosting at Photobucket

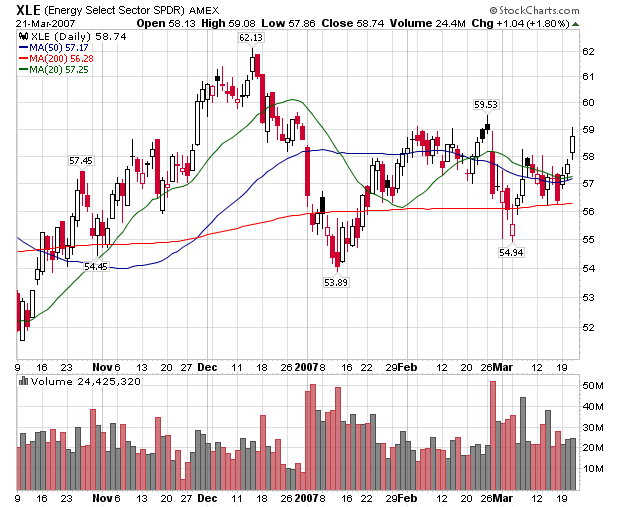
And while the energy sector had decent volume, it wasn't anything like the level in the financials are consumer discretionary ETFs.

Photo Sharing and Video Hosting at Photobucket

Food for thought.

Wednesday, March 21, 2007

Inflation Picture -- It's Not That Good

This chart is from the blog The Mess That Greenspan Made. When looking at it, remember the Fed's inflation target is 1% - 2%.

Photo Sharing and Video Hosting at Photobucket

The Markets Today

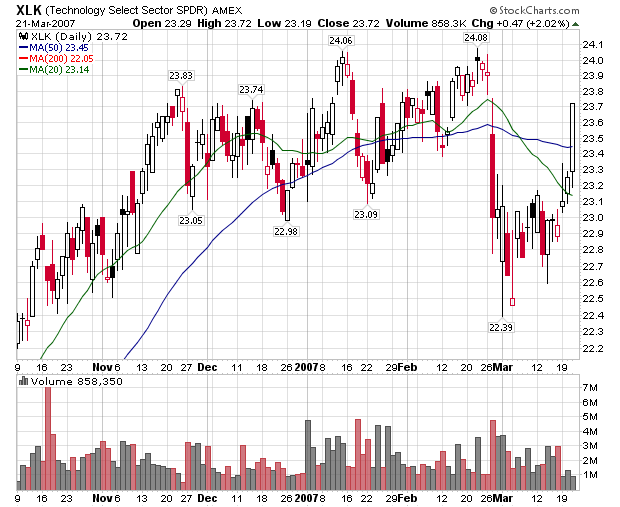
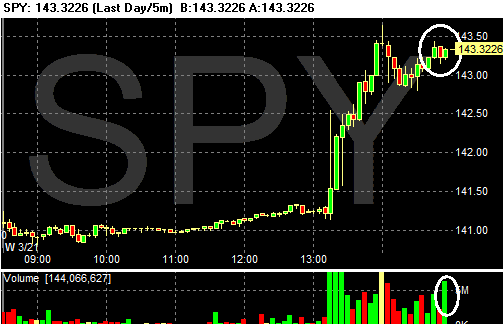
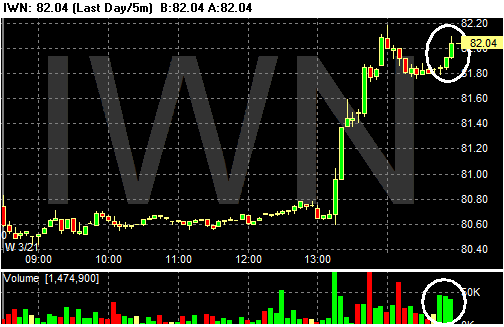
OK -- despite the fact I disagree strongly with how the market interpreted the Fed's statement (see below), the markets rallied strongly to the Fed's news. Notice two things about today's charts.

1.) The markets rallied as soon as the Fed released their statement.

2.) The markets closed near their highs on strong volume.

Photo Sharing and Video Hosting at Photobucket

Photo Sharing and Video Hosting at Photobucket

Photo Sharing and Video Hosting at Photobucket

Here's the 3-month chart of the markets. Notice that today's rally printed a very strong bar on very strong volume. The IWN's volume is a bit weaker than the SPYs and QQQQs, but it is still higher than previous days.

Photo Sharing and Video Hosting at Photobucket

Photo Sharing and Video Hosting at Photobucket

Photo Sharing and Video Hosting at Photobucket

Fed Keeps Rates Unchanged; Inflation Still a Concern

Here's the text of their statement:

The Federal Open Market Committee decided today to keep its target for the federal funds rate at 5-1/4 percent.

Recent indicators have been mixed and the adjustment in the housing sector is ongoing. Nevertheless, the economy seems likely to continue to expand at a moderate pace over coming quarters.

Recent readings on core inflation have been somewhat elevated. Although inflation pressures seem likely to moderate over time, the high level of resource utilization has the potential to sustain those pressures.

In these circumstances, the Committee's predominant policy concern remains the risk that inflation will fail to moderate as expected.
Future policy adjustments will depend on the evolution of the outlook for both inflation and economic growth, as implied by incoming information.

Voting for the FOMC monetary policy action were: Ben S. Bernanke, Chairman; Timothy F. Geithner, Vice Chairman; Thomas M. Hoenig; Donald L. Kohn; Randall S. Kroszner; Cathy E. Minehan; Frederic S. Mishkin; Michael H. Moskow; William Poole; and Kevin M. Warsh.


Translation: Inflation is too high; it hasn't come down as expected. We're still expecting a slowing economy to lower inflation.

We're not lowering rates anytime soon.

Dollar Update

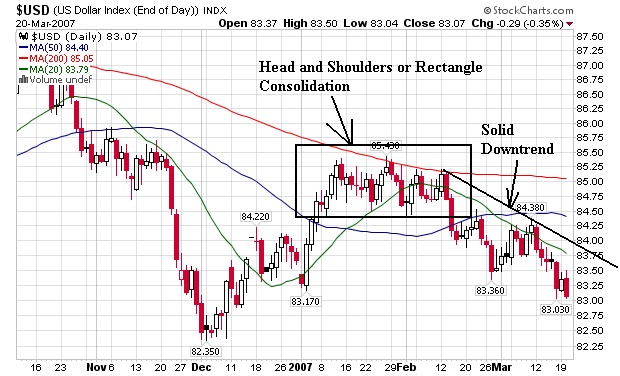
The US Dollar is Still in a Downtrend. Here is the daily chart.

Photo Sharing and Video Hosting at Photobucket

Notice the dollar consolidated in a rectangle or head and shoulders patters from mid-January to early February. Since then it has sold off making lower highs and lower lows. In other words, the short-term trend is is bearish.

Here's the weekly chart which also shows a bearish trend:

Photo Sharing and Video Hosting at Photobucket

We had a bear market rally from May to June of last year, but the buying pressure was not strong enough to break the downtrend. Also note that all three moving averages on this chart -- a 20, 50 and 200 day simple moving average -- are all pointing lower.

Oil Demand Increasing

From CBS MarketWatch:

And "with the energy demand showing no signs of abating, there seems to be a growing concern that OPEC's decision to keep output unchanged might result in a supply shortfall, which could leave refineries unable to boost runs enough to replenish gasoline supplies, setting the stage for a sharp upward price spiral," he said in an e-mailed note to clients.

Francisco Blanch, an analyst at Merrill Lynch, said in a research note Tuesday that oil demand is "expanding strongly relative to last year in sectors such as transportation, petrochemicals and power generation." And in emerging markets, oil demand is "looking very strong with China, India and other countries taking in substantially more fuel for transport and petchem use than last year," he said.


In other words, don't be surprised to see oil prices rebound in the next few months.

Econ 101: increasing demand = increasing price.

Housing Short Sales Increasing

From Bloomberg:

Homeowners such as the Rhode Island couple are finding their mortgage companies eager to accept a sale price that falls short of a property's loan balance -- a so-called mortgage short sale. The number of U.S. loans entering foreclosure reached an all-time high in the fourth quarter, according to the Washington-based Mortgage Bankers Association. That's spawning a cottage industry of real estate investors who profit as lenders try to avoid adding properties to their portfolios.


Basically the owner turns over the house to the mortgage company, who in turn puts the house on the market or quickly sells the house to a private investor. This gets the house off of the companies books and may help to prevent a longer-term loss for the bank/lender.

However, this practice will drive prices down as the seller is very motivated to sell and therefore will accept a lower price.

The short sales may mitigate the impact of the housing slump as the properties avoid being tallied as foreclosures. At the same time, they will help push the U.S. median home price to a third consecutive quarterly decline in 2007's first three months, Berson said.


The problem is no one tracks this market so we have no idea what the actual impact it.

Fed Day

The Federal Reserve will announce its interest rate decision at 2:15 EST today. Don't expect a major change in interest rate policy because it won't happen. However, the entire financial world as we know it will stop until 2:15 EST.

Tuesday, March 20, 2007

Credit Standards Are Tightening

From Bloomberg:

......Countrywide Financial Corp., the biggest U.S. mortgage provider, last week stopped taking applications for no- money-down loans from risky borrowers without proof of income.

The new constraints on lending may be real-world evidence of the ``lags'' in monetary policy that policy makers flagged when they ended two years of rate increases in August. The central bank will keep its benchmark rate at 5.25 percent, economists predict, counting on slower growth and past rate boosts to bring inflation within their tolerance zone.

``The market is definitely tightening standards, and to the degree the market controls the flow of capital, the Fed does not have to,'' said Carl Tannenbaum, chief economist at ABN Amro Holding NV's LaSalle Bank in Chicago. Officials have kept their tightening bias at the past five meetings, meaning any policy shift is likely to be a rate increase.

.....Wells Fargo & Co., the largest U.S. subprime lender, said in a March 7 statement to Bloomberg News that it changed standards effective Feb. 16 for some risky customers.


And housing starts increased today. Just who is going to buy those new houses? Total household debt is now over 90% of total US GDP; debt payments as a percentage of disposable income are at a record. How must more debt can the US consumer put on his books?

The Latest Rally is Suspect

While prices have increased for the SPYs and QQQQs, volume has decreased. This is a bearish signal.

Photo Sharing and Video Hosting at Photobucket

Photo Sharing and Video Hosting at Photobucket

My guess is traders are waiting on the sidelines for the Fed's decision tomorrow. I don't think anybody thinks the Fed will do anything about rates. Instead I think people are waiting for the Fed's statement to see if anything has really changed.

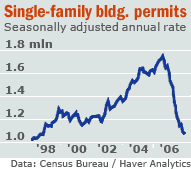
Building Permits: Falling Off a Cliff

Sometimes a graph says it all:

Photo Sharing and Video Hosting at Photobucket

Housing Starts Increase

From Bloomberg:

Housing starts rebounded in February from a nine-year low, easing concern that the U.S. real-estate slump will worsen and threaten the economic expansion.

Builders broke ground on new homes at an annual rate of 1.525 million last month, up 9 percent from the prior month and more than economists forecast, the Commerce Department said today in Washington. Building permits fell 2.5 percent.

The numbers eased speculation that climbing defaults on subprime mortgages would put additional homes on the market, leading builders to halt more projects and fire workers. At the same time, swings in the monthly figures don't convey the stability desired by Federal Reserve policy makers, who meet today and tomorrow to set interest rates.


The South and West rose 18% and 26.4% respectively. These figures are the primary reason for the increase, as the Northeast dropped 19.7% and the Midwest dropped 14.4%.

Frankly, I have a hard time explaining these numbers. According to the latest new home sales report there is a 6.8 month supply of new homes on the market. In addition, new home sales were down 20% year-over year. Credit standards are tightening. And there are estimates of the subprime problems adding between 500,000 to 1.5 million homes to inventory. This is not the time to be adding to available inventory.

More Subprime Problems

From IBD:

The big subprime mortgage lender said 4 more states have issued cease-and-desist orders, joining N.Y. and Mass. Deutsche Bank (DB) asked New Century Fin'l (NEWC) to quickly buy back $900 mil of its loans. New Century fell 7% to 2.17. Accredited Home Lenders, (LEND) which rallied in pre-market on financing talks, fell 18%. Fremont Gen'l, (FMT) which wants to sell its subprime unit, fell 9%.


There's been a steady drip drip drip of bad news from the subprime sector for the last few months. This is simply another one of those drips.

So far the damage has been contained. But I wonder how much longer that will last. While most mortgages are pooled, securitized and sold to investors there are still companies that hold mortgages on their books. Yesterday I linked to an article by Kash over at the streetlight which showed banks are more exposed to this problem then we want to admit.

I have no idea if the proverbial dam is going to burst on this issue. But the signs are definitely worrying.

Yesterday's Rally Occurred on Weak Volume

From IBD:

Stocks rallied Monday, but sharply lighter volume took the juice out of the session's gains.

The Nasdaq picked up 0.9%. The S&P 500 climbed 1.1%, the Dow industrials 1%. The small-cap S&P 600 also tacked on 1%. But volume receded 19% on the Nasdaq and nearly 30% on the NYSE.

.....

Two factors weighed on Monday's volume. The lack of option-fueled trading certainly played a part. Big investors also were reluctant to trade heavily ahead of the two-day Federal Open Market Committee meeting that begins Tuesday.

Still, Monday's trading level came in below Thursday's tally, and was the second-lowest total since the last week of 2006, when traders stayed home for the holidays.


Volume is one of the best technical indicators around because it shows the actual level of activity and/or enthusiasm. The reasoning is simple: if people are really excited about buying something more people will participate in the rally. If people aren't excited, they won't.

One of the oldest and most reliable technical indicators out there is a rally on continually decreasing volume. A rally on decreasing volume indicates people are less and less excited about an issue and the therefore the price is about to drop.

Food for thought.

Bank of Japan Leaves Rates Unchanged

From the WSJ:

Bank of Japan board members Tuesday voted unanimously to leave monetary policy steady, in line with indications from the central bank that it wouldn't immediately follow a rate rise in February with a further policy tightening.

Analysts expect the BOJ to raise interest rates further but not until economic data show domestic demand is picking up and price pressures increase after moderating due to a recent fall in global oil prices.


The carry trade -- borrowing in Japan at low rates and lending in the US at higher rates -- has been an important source of financing for hedge funds for the last 5+ years. So long as the interest rate differential is still advantageous for the trade it will continue.

Tomorrow the US Federal Reserve will issue its interest rate policy decision. While there has been speculation the Fed will lower rates soon, I still think that is wishful thinking. We'll have to see how their official statement comes out, but I doubt we'll see much meaningful change.

Monday, March 19, 2007

Homebuilder Confidence Drops

From Bloomberg:

U.S. homebuilders turned more pessimistic this month on concern that buyers will find it harder to obtain loans after a wave of defaults in the subprime mortgage market.

The National Association of Home Builders/Wells Fargo index of sentiment fell to 36 this month from February's revised 39, the first decline since September, the Washington-based association said today. A reading below 50 means most respondents view conditions as poor.

Homebuilders, struggling to recover after more than a year of slumping sales, now face the possibility that a surge in defaults on subprime mortgages will make other types of home loans harder to get. That may provide a greater drag on construction as builders hold off starting work on more houses until completed ones are sold.


CBS Marketwatch added:

"This is a strong signal that housing will remain a drag on the economy through spring and probably summer as well," wrote Patrick McPherron, an economist for Moody's Economy.com. He concluded that, after seasonally adjusting the numbers, optimism about prospective buyers was an all-time low.


There has been a pretty big debate between the housing bulls and bears over the last 3-5 months. I have been a housing bear for some time, largely because of the huge inventory overhang. The subprime situation has only increased the level of my bearishness. This news simply ups the ante some more. When industry participants are concerned you have to wonder about the overall health of the industry.

Our Low-Wage Nation

Of the 44 million jobs in the United States, nearly one in three of the total pays low wages—and often does not include affordable health insurance, paid sick days or retirement coverage. That eye-opening information, provided in a new report by The Mobility Agenda, finds these $11.11-an-hour-or-less jobs also tend to have inflexible or unpredictable scheduling requirements and provide little opportunity for career advancement.

So maybe that’s why when Bush touts the nation’s low unemployment rate, few people outside Wall Street cheer. They are too busy working several jobs to make ends meet.

The Mobility Agenda, a special initiative of Inclusion, a virtual think tank affiliated with the Center for Economic and Policy Research, finds that since 2001, there has been a sharp decline in wages for workers at the bottom third of the wage scale. Worse, reviewing the evidence on economic mobility, the authors of Understanding Low-Wage Work in the United States conclude:

In the U.S. labor market, it is not possible for everyone to be middle class, no matter how hard they work. Moreover, it has been getting harder to do over time.

Oh, and about that middle class. A devastating report by Robert Pear in The New York Times March 5 documents the economic fragility of the U.S. middle class when it comes to paying for health care.

Seems that more than one-third of those without health insurance—17 million of the nearly 47 million—have family incomes of $40,000 or more, according to the Employee Benefit Research Institute, a nonpartisan organization. More than two-thirds of the uninsured are in households with at least one full-time worker. As Pear writes:

It is well known that the ranks of the uninsured have been swelling; federal figures show an increase of 6.8 million since 2000.

(The AFL-CIO supports universal health care, and last week, the AFL-CIO Executive Council approved a statement saying such a system should be built upon the nation’s most successful universal health coverage plan for seniors—Medicare.)

A confluence of forces is behind the sinking of the middle class. But one big factor is the disproportionate gain by corporations in the growing global economy. So wide is the gap, in fact, that even the denizens of economic world leadership, at their annual gathering in Davos, Switzerland, this year started humming a new refrain: Globalization isn't working for everyone. According to The Wall Street Journal (subscription required):

Stagnating wages and rising job insecurity in developed countries are creating popular disenchantment with the free movement of goods, capital and people across borders.

In theory, less-developed countries win from globalization because they get jobs making low-cost products for rich countries. Rich countries win because, in addition to being able to buy inexpensive imports, they also can sell more sophisticated products like machine tools or financial services to emerging economies.

"The first win is there, but the second win is going to the owners of capital rather than labor," says Stephen Roach, chief economist at Morgan Stanley.

Ouch. There’s that capital-and-labor dichotomy again. From Morgan Stanley, no less. Guess it didn’t go away with the 20th century after all.

Several key factors are fueling the inequities in globalization. One is the rapid growth of foreign direct investment by U.S. corporations to other countries—while internal investment is decreasing. According to economist Thomas Palley:

Since investment in the U.S. is critical for future economic prosperity, these patterns are troubling and provide evidence of how globalization and flawed policy are encouraging corporations to abandon America.

With regard to outward [foreign direct investment], part of the increase is attributable to affirmative improvements in emerging market economy prospects, but part is due to bad policy. The over-valued dollar has encouraged U.S. business to shift productive investments from the U.S. to both developing and other developed economies, while the lack of global labor and environmental standards encourages shifts to developing economies where standards are lower or even absent.

Another factor is the preferential tax treatment of foreign profits of U.S. corporations, which encourages outward FDI that displaces domestic investment. This speaks to repealing that provision.

Palley notes the U.S. Commerce Department recently launched an initiative to promote such investment, promising to actively court foreign companies. But the approach, while beneficial, also is “incomplete and inadequate.”

Cheerleading cannot substitute for fundamental policy change...the exclusive focus on [internal direct investment] is like one-hand clapping and completely misses the problem of investment off-shoring by U.S. corporations.

Another factor exacerbating the gap between what the wealthy are paid and everyone else is excessive CEO pay. We’ll discuss that in a couple weeks, when the AFL-CIO releases its Executive PayWatch report in early April.

Photo Sharing and Video Hosting at Photobucket

Source: http://www.inclusionist.org/files/lowwagework.pdf
Go Read This Now

Kash at the Streetlight Blog looks at banks exposure to real estate.

It's not a fun read, but a crucial read.

Can We Please Stop With the Rate Cut Talk?

From Bloomberg:

Federal Reserve officials may cling this week to their bias for tighter credit, setting themselves up for bigger interest-rate cuts later in the year if the economy continues to lose momentum.
``The Fed is often a little behind the curve when you get to these turning points,'' says J. Alfred Broaddus Jr., president of the Richmond Fed from 1993 to 2004. ``The reluctance to move toward ease once you have an inflation bias in place may be just a fact of life if you are concerned about credibility.''


Fed officials have been very clear in their public speeches over the last few months. All of them -- let me repeat that ALL OF THEM, AS IN EVERY LAST ONE, AS IN NO ONE HAS SAID ANYTHING DIFFERENTLY -- have said inflation is too high.

The Year-over-year CPI number is 2.7% -- way above the Fed's publicly stated inflation target of 1%-2%. That means inflation has to come way down before the Fed will cut rates.

Now, the Fed could change their bias from anti-inflation to growth. But they haven't said that yet.

Oil Market Update

Here's a daily chart for oil:

Photo Sharing and Video Hosting at Photobucket

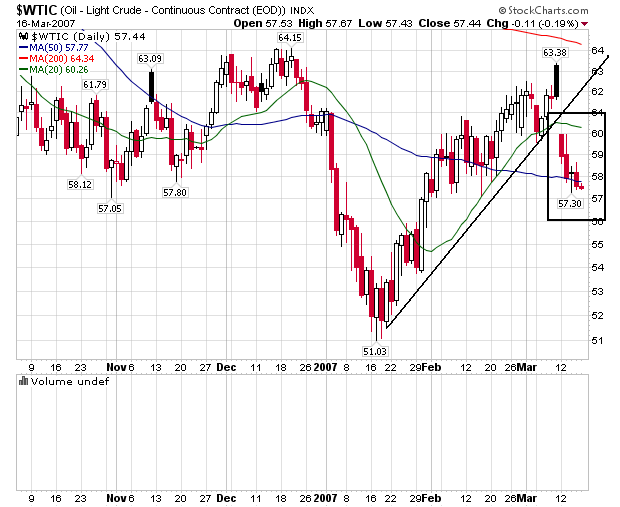
The market gapped down last week. Now it's resting on the 50-day SMA. Gaps down are usually bearish signals, as they indicate selling pressure is strong enough to force prices to open lower.

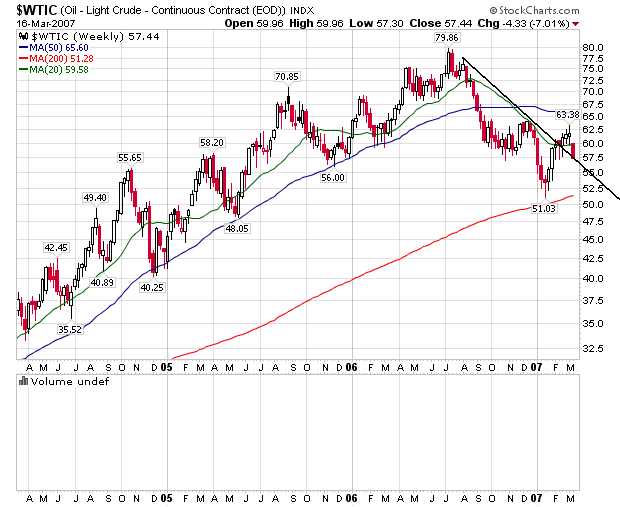
Here's a weekly chart to place last week's action in longer-term perspective. I'm going to put this one up twice with two different analysis.

Photo Sharing and Video Hosting at Photobucket

The oil market broke the downtrend. Now the downtrend may move from resistance to support. We'll have to wait until Friday to see how this closes.

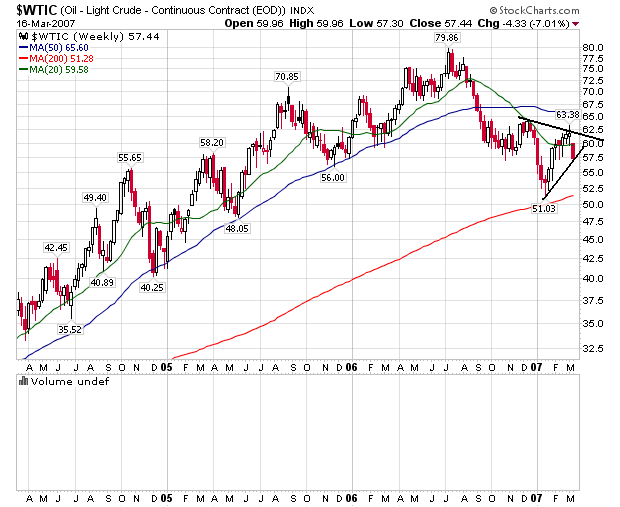
Here's another look:

Photo Sharing and Video Hosting at Photobucket

Oil is consolidating in a triangle formation.

Let me add my standard TA caveat: TA isn't an exact science; the markets will do anything and everything they can to make an ass of you.

Keep Your Eye On Financial Stocks

From the WSJ:

A look at the losers and bigger losers since the stock market began its bumpy ride late last month offers hints about what it will take for the market to rebound in the weeks ahead.

Analysts are keeping an especially close eye on financial stocks, which, beset by woes in the business of selling mortgages to risky subprime borrowers, have been the hardest hit. The sector is something of a bellwether for the market because of its size and because it reflects big-picture economic issues such as inflation.

The financial sector of the Dow Jones Wilshire 5000 index is off 5.5% since the market's one-day plunge on Feb. 27, compared with a 4.4% drop for the whole index. The utilities sector, an investor haven because consumers need to keep the lights on and the water running no matter how shaky the economy, is down just 2.9% in the same period, the second-best performance of the index's 10 sectors.

"Investors have clearly been trying to get more defensive in their portfolios the last few weeks, which is understandable," says strategist Mark Keller of A.G. Edwards & Sons in St. Louis. "They're still in a mode of shedding risk, and things should stay that way awhile longer."


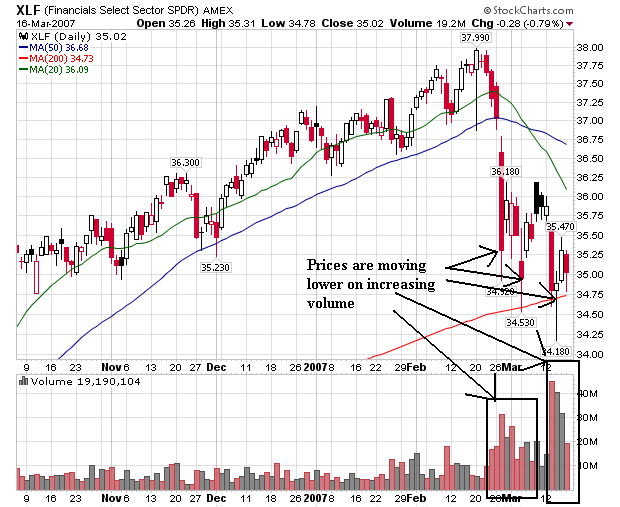
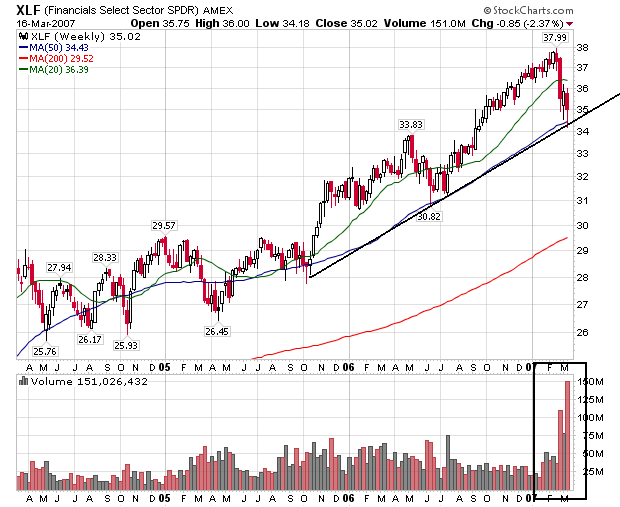
Let's take a look at the longer-term Financial ETF to see what the sector looks like.

Photo Sharing and Video Hosting at Photobucket

This chart says it all. Prices are moving lower on higher volume. That indicates selling momentum is increasing which is a bearish signal.

Here's the weekly chart, which shows a few years of price action:

Photo Sharing and Video Hosting at Photobucket

We're still in an uptrend. However, notice the volume spikes over the last three weeks and the downward price movement. If the XLFs move over (roughly) $34.25 on heavy volume, close at that level then stay there for a few days, then the uptrend of the last few years will be broken. That will be a technically important market event and could signal further downward price action for the overall market.

Sunday, March 18, 2007

Inflation Isn't Under Control

From Business Week:

Core year-over-year CPI price growth, at 2.7%, is above the Fed's preferred 2% soft target for this measure that is roughly consistent with the 1%-2% comfort zone for the core chain price index for personal consumption. And the headline year-over-year gain moved upward to 2.4% from 2.1%. The core year-over-year rate may drift down toward the 2.5% area through mid-year due to easier comparisons, but this may not suit a Fed that would probably like to see the figures "comfortably" and sustainably within the preferred range, and not just dancing at the upper end.


A few points:

1.) A central tenant of central bank thinking over the last 6-9 months is that a slowing economy would lead to lower inflation. That hasn't materialized yet. While oil prices are down, they certainly aren't deflationary yet. And agricultural prices are rising, indicating they may take oil's place as the inflation area of concern.

2.) All of the fed governors have publicly stated inflation is still too high. This implies we are nowhere near a rate cut even if the economy slows.

3.) We are nowhere near stagflation. While the overall inflation level is still a concern, it is hardly at out-of-control or runaway levels. However, the overall inflation level is still way too high to consider a rate cut.

How Confident Are Consumers?

I have never been a huge fan of surveys about what people say; I've always thought people's actions were far more important. Who wants to sound like a grump? But when people are spending less, it means that much more.

Before we get any further, let's make an assumption: people buy houses and cars when they are feeling more confident about the future. This has been a standard line of economic reasoning for awhile. People need to feel confident about the future in order to take on a financial responsibility that will last at least 5 years.

If the preceding statement is true, consumer confidence may not be that high. According to Barron's pulse of the economy we have the following year-over-year figures for car and new home sales.

Total domestic auto sales totaled 567,880 one year ago and 520,946 in February 2007. That's a drop of 8.42%.

Total light truck sales were 692,929 in February 2006 and 694,297 in February 2007. That's an increase of .18%.

New home sales were 1,197,000 in January 2006 and 937,000 in January 2007. That's a decrease of 21.72%.

There are other possible reasons. For example, maybe all of the household debt is starting to slow the purchase of durable goods. Considering the sky-high levels of debt in the economy that may be a possibility.

But whatever the reason, we know people are backing away from big-ticket purchases. That may mean people aren't feeling all that confident right now.