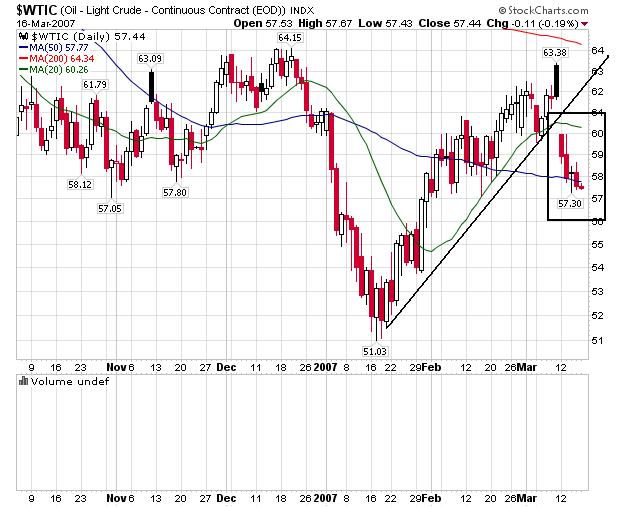
The market gapped down last week. Now it's resting on the 50-day SMA. Gaps down are usually bearish signals, as they indicate selling pressure is strong enough to force prices to open lower.
Here's a weekly chart to place last week's action in longer-term perspective. I'm going to put this one up twice with two different analysis.
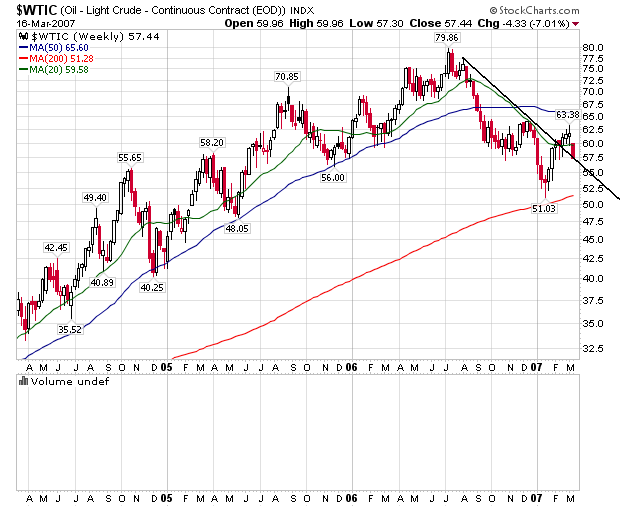
The oil market broke the downtrend. Now the downtrend may move from resistance to support. We'll have to wait until Friday to see how this closes.
Here's another look:
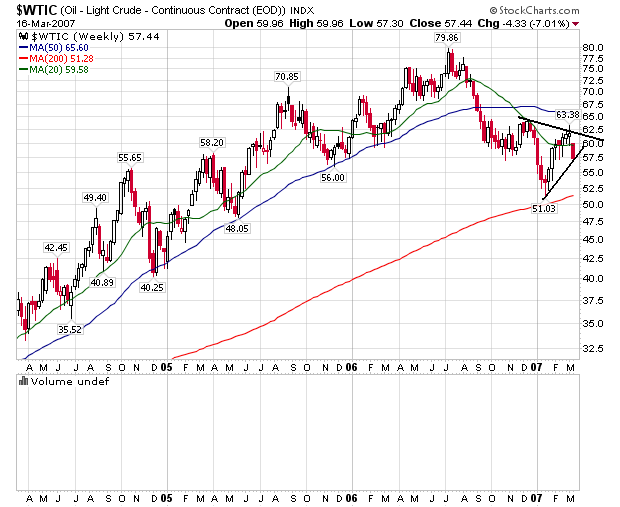
Oil is consolidating in a triangle formation.
Let me add my standard TA caveat: TA isn't an exact science; the markets will do anything and everything they can to make an ass of you.