A sharp drop in freight shipped across the Pacific during the past two months suggests the shipping-industry slump is about to get worse.
At the major ports of Los Angeles and Long Beach, Calif., which bring in nearly two-thirds of West Coast containerized goods, import volume fell 8.8% in both January and February compared with a year earlier, as the weakening economy, tough housing market and high gasoline prices eroded U.S. demand.
.....
Transportation companies like FedEx offer a window into the pernicious effects of a slow economy and rising commodities costs.
Slow growth and high energy costs seem to have squeezed FedEx's third-quarter earnings, due to be reported today. Analysts surveyed by Thomson Financial expect it to post net income of $1.22 a share, down 10% from a year ago.
Rival UPS warned last week that it could miss first-quarter earnings targets after six straight weeks of negative volume in its U.S. package business. Kurt Kuehn, UPS's chief financial officer, said "across a very broad segment of our customers there is a slowing in shipping needs."
High energy prices and weakening demand have also thumped truckers. The American Trucking Associations expects truckers to spend $135 billion on fuel this year, up 20% from 2007. Several trucking companies describe the environment today as the worst they've seen, say Morgan Keegan analysts.
Trouble in transports signals a bad outlook more broadly. FedEx shares tumbled in 1999, before the rest of the market. The "FedEx Indicator" seems to be working well again. Its shares started dropping in July and are down 26% since then. The Dow Jones Industrial Average didn't start slipping until October
Simply put, the transports are a great way to keep track of how the economy is doing. If it's going well, people will have to ship more and more stuff from point A to point B. If things aren't going well, people will be shipping less stuff from point A to point B.
I've touched on the following story before, but it's still very relevant to the current situation:
U.S. airlines, which seemed last year to have shaken off a half-decade slump, may face a new round of restructuring amid a stumbling economy and spiraling fuel prices.
The turnabout reflects the headwinds that have buffeted the industry as oil prices have risen 75% in the past year and the housing slump has mushroomed into a broader credit crisis, making it hard for many businesses and households to borrow and prompting consumers to cut back on spending. Most economists now think the U.S. has slipped into a recession, and the debate is shifting to how deep the downturn will be.
Other industries, from the nation's beleaguered banks to retailers and auto makers, are facing similar pressures. But the major airlines, many of which have spent long periods under bankruptcy protection in recent years, worry they are especially vulnerable.
Let's take a look at some charts.
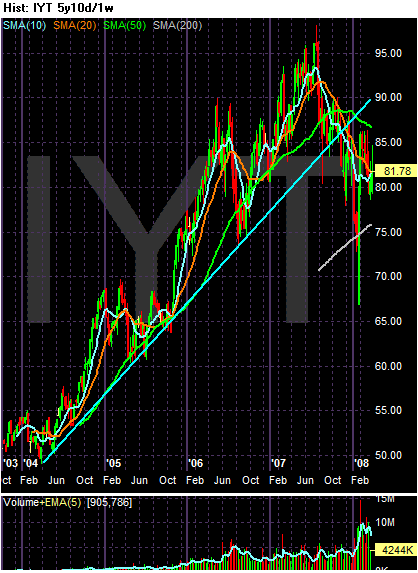
The transportation index was one of the charts that originally led to to make a bear market call. The index had dropped pretty hard. Since then it has bounced back, although not enough for me to change my opinion about the market's overall direction.
Above is the 5 year chart in one week increments. Notice the clear trend break that occurred at the end of last year. Also note how the index has bounced back since the first of the year.
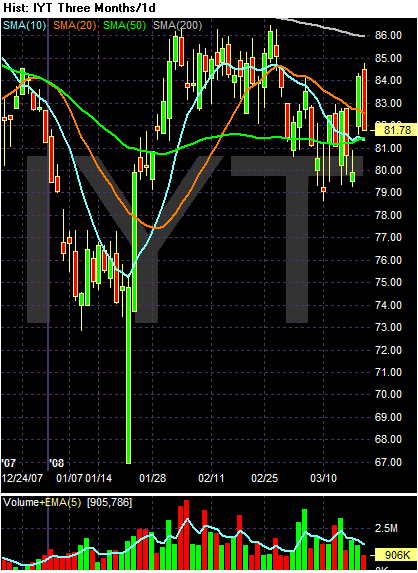
The three month SMA chart shows the bounce back. Notice how the index moved from lows of around 74 - 76 in January to the current levels in the low 1980s. Also note the average is moving closer to the 200 day SMA. But the rest of the SMA picture is cloudier. Notice that prices and the shorter SMAs (10, 20 and 50) are tightly packed around 81. That indicates there is a great deal of uncertainty about where this average is going. Also notice the average is inching back to the 200 day SMA. A cross above this like and a sustained presence about it could indicate an overall change in the market's thinking about the economy.
Let's take a look at the sub-industries
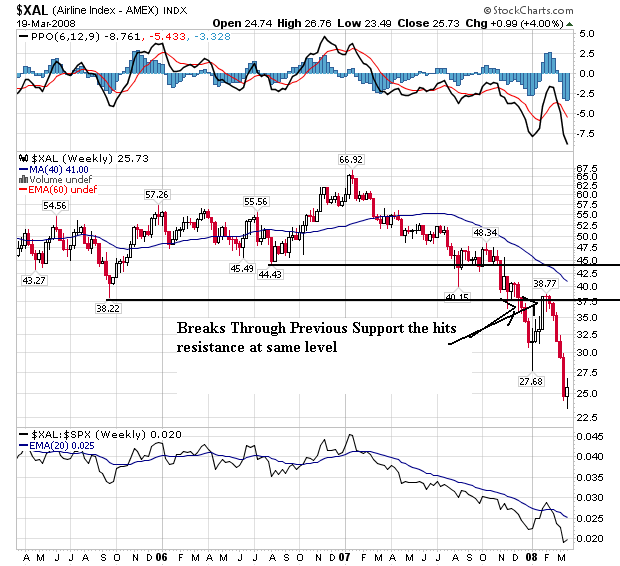
Airlines are clearly in a downtrend. They've been selling off since the beginning of 2007. Notice at the end of last year they fell through a price level established in late 2005 and then rallied into that level and failed in early 2008. That means there is probably further trouble ahead for this sector.
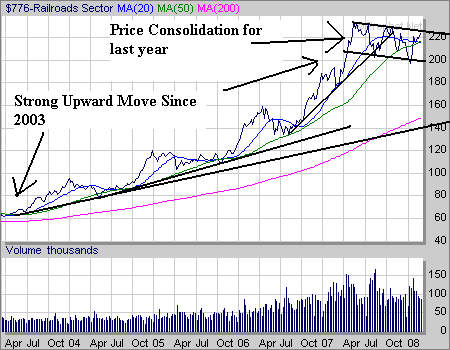
Rail has a stronger chart. Notice that it hasn't dropped nearly as hard as the broader transport index or the airlines. The sector has been in a consolidation pattern for the last year. Rail has a more solid customer base. For example, they help to transport oil and coal which will be used regardless of the overall economic situation.
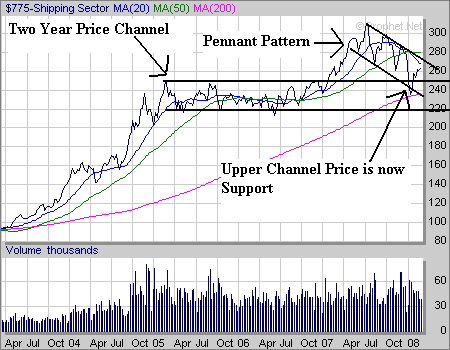
Shipping was in a two year price channel in 2005 and 2006. It broke out of that channel in 2007, but has been in a downward sloping pennant pattern since last summer.
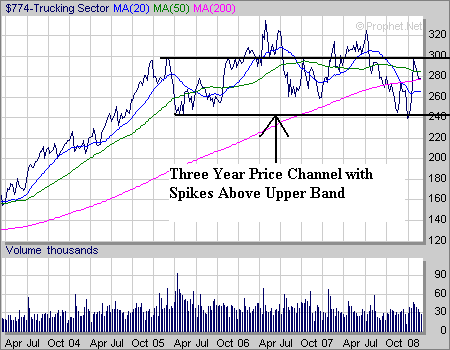
Trucking has essentially been in a three year long consolidation pattern since the beginning of 2005. Prices have moved between 240 and 300 on the chart with tow spikes about those levels. But the index couldn't keep the the upward momentum.
Overall, the sub-industries indicate traders are concerned but not panicked about the sector. They're taking some profits, but not aggressively selling.