Sunday, July 8, 2007

Where Are All the New Products?

Railroads

These charts are from Transmatch:

13-week rolling average

Photo Sharing and Video Hosting at Photobucket

4-week rolling average
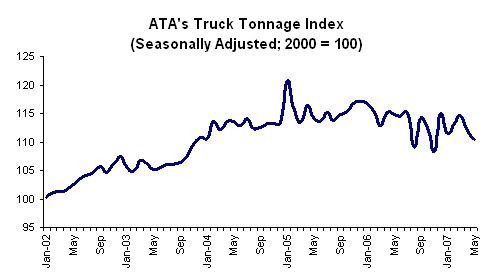
Photo Sharing and Video Hosting at Photobucket

Trucking

From Truckline

Photo Sharing and Video Hosting at Photobucket

1 comment:

HoosierDaddy said...

Odd that on transmatch, autos are back up to their year ago numbers after lagging most of the year.

http://railfax.transmatch.com/
Looks like Forest Products is the big loser, as you would expect in the declining housing market. Also Grain is declining and chemicals are increasing (ethanol?). Those seem to be the big changes. The Canadians seem to be doing alright for themselves.

The truck tonnage report sure has picked up some wild volatility over the last year (last big swing before that looks to be Katrina related), I wonder if that is data quality or a real issue. Perhaps an inventory boom/bust cycle or an attempt to adjust rates in the midst of rising costs and a capacity glut (due to the massive pre-buy of trucks in '06 to avoid EPA rules taking effect in '07). Longer term, Shippers were traumatized by availability issues and high rates during the surge season (Jun-Dec) in 04 so they have worked to more intelligently manage inventory, trailer cube (by combining shipments) and made better use of intermodal which probably is going to result in some secular reduction in shipments overall, and especially 3rd and 4th Quarter shipments. In 05 that was masked by a strong demand for building materials, in 06 though the Surge was much spottier than in years past.