Showing posts with label consumer spending. Show all posts

Tuesday, March 20, 2012

Why haven't consumers stopped spending?

- by New Deal democrat

As I've noted a number of times, exhausted consumers are the best case for economic pessimism.
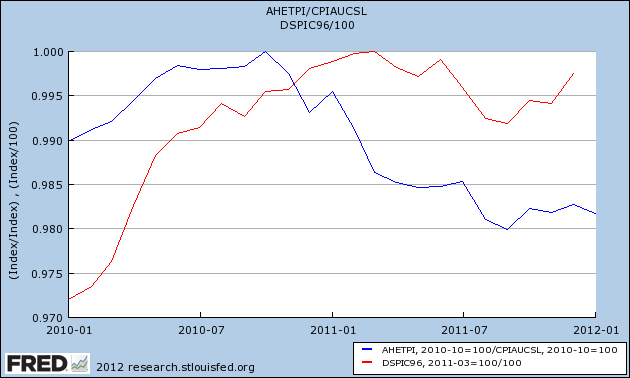


Real wages have declined by about 2% since late 2010. Real disposable income also declined beginning in spring 2011 and did not make up all of the loss by year's end. Meanwhile, those consumers have been faced with yet another spike in gas prices.

So, why haven't consumers thrown in the towel? Part of the answer is that they have spent much of the savings they accumulated since the onset of recession in 2008. Another is that consumers appear to have become singularly focused on energy efficiency, finding ways to cut back on gasoline usage rather than purchases of other products and services.

A third important part is refinancing debt at lower interest rates, thus freeing up more disposable income. Since 1981, mortgage rates have almost relentlessly declined, allowing consumers to refinance their debt at lower and lower rates frequently. Most of the time, this has masked the fact that median, and even mean, household incomes, have stagnated or declined. For example, we know that median household income has never equalled its peak in 1999. Despite that fact, recessions, including the severe 2008-09 recession, have only occurred when at least 3 years have passed without consumers having the opportunity to refinance, as shown in this graph of mortgage rates, which highlights those periods where interest rates are higher than they were 3 years prior in red:
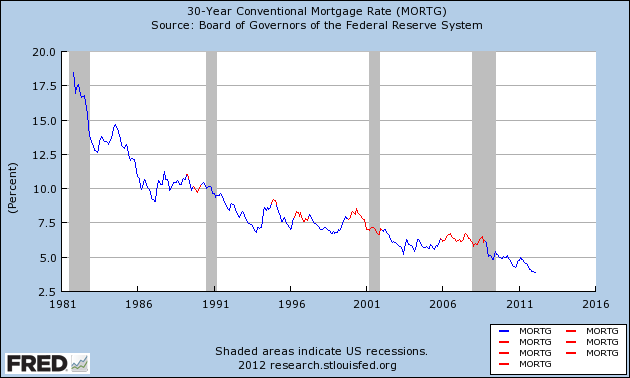


All three recessions since the end of the 1981-82 recession have occurred at those times, including 1990, 1999-2001, and 2006-08. Lest you think this is some new metric I'm reporting on in order to justify bullishness, I noted its importance to avoiding recession as early as 2007, saying that Hard Times were near, and it was an important reason why I said a recession looked likely by late 2007.

The importance of the continued ability to refinance debt at lower rates is shown in this graph from Mortgage News Daily showing the amount of refinancing over the last 5 years compared with mortgage rates:


You can see that refinancing slowed to a trickle in 2007, but picked up as rates fell in the latter part of the recession, and again each time rates have made a new low since, including the last 9 months. As a result, household debt as a share of disposable income has resumed its decline as of the most recent release, covering Q4 2011, by the Federal Reserve, shown below:


The household debt ratio (blue) is now down to 10.88%, only 0.28% above the series' all time low. Total financial obligations (red) are down to 15.93%, also only 0.43% above their lowest level since the series began over 30 years ago.

Since 1982 it has been true that, so long as households can refinance at lower rates, a recession has been avoided. This is a crucial piece of the puzzle as to why consumers haven't rolled over and cut back on spending in the last year, putting the economy back into recession.

Monday, March 19, 2012

Consumer spending pattern does not support ECRI's recession call

- by New Deal democrat

This week I want to revisit and update my forecast from the beginning of the year. That forecast boiled down to softness in the first half, possibly including one quarter of negative GDP but escaping a recession, and a stronger second half. Since that time I've written a number of posts considering ECRI's recession call, trying to understand their argument while at the same time noting the wealth of contrary data. Since I don't get to write the headline when my blog posts are republished elsewhere, let me be clear about my current thinking as to ECRI's calls. That is:

1. their original call for a recession by the end of 2011 was wrong. Period. Doubters need to go back and listen to the September interview on CNBC where Lakshman Achuthan was very explicit that the recession would start no later than the next quarter, i.e., 4Q 2011.

2. the jury is out on their revised recession call of recession by the end of 2Q 2012 (although the data continues to tilt away from that view).

3. the original explanation for the revised recession call, made in a series of interviews a few weeks ago, was pathetically lame. The updated explanation last week, which seems to be a direct response to my recent post, was more nuanced and explanatory.

It'll take a number of posts to state my forecast more thoroughly, but today let me address one point. The best bearish case rests on a weakened consumer whose wages have not kept up with inflation, who is now being battered by yet another spike in the price of gasoline. This is an extremely reasonable point, and appears to underlay ECRI's position, which is that economies don't "muddle along" at sub-2% growth. If an economy decelerates under 2% YoY growth, a recession soon follows. Sputtering real personal consumption expenditures show that the economy is now slowing down into reversal.

As it happens, there is a very important contrary example to the sub-2% thesis, but I'll get to that in another post. In the meantime, let's look at real PCE's. First of all, here's a graph that appeared on Business Insider as the graph that makes ECRI scream recession:


PCE's certainly are very weakly positive YoY at this point. The graph suggests that nonfarm payrolls will follow on a YoY basis.

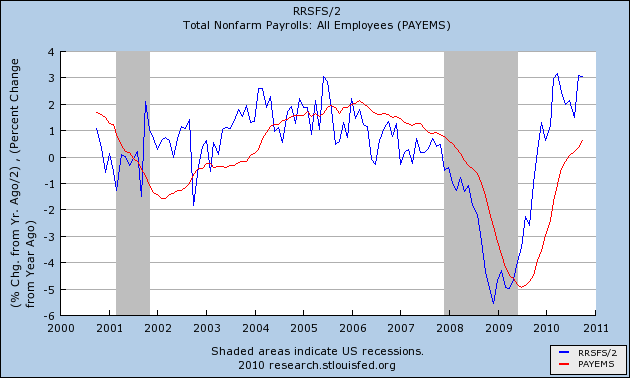
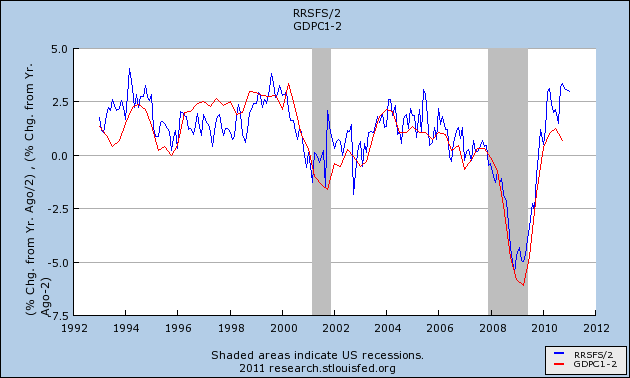
The problem is, real retail sales also lead nonfarm payrolls . Take the YoY% change in real retail sales, divide by two, and you usually come pretty close to the YoY% change in nonfarm payrolls about 6 or so months later, as shown for the last 10+ years in this graph:


Retail sales constitute about 50% of PCE's. It should be no surprise, then, that the two make peaks and troughs simultaneously:


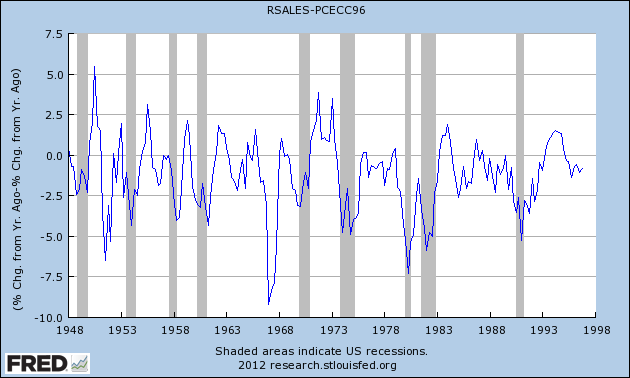
Note, however, that real retail sales are much more volatile. And, as this graph below (subtracting YoY PCE growth from YoY real retail sales growth through 1997) shows, in a very specific and non-random way:


Note that early in economic expansions, YoY real retail sales growth far outstrips YoY PCE growth. As the economy wanes into contraction, YoY real retail sales grow less and ultimately contract more than YoY PCE's. You can see that by noting that retail sales minus PCE's are always negative BEFORE the economy ever tips into recession. That's 11 of 11 times. Further, in 10 of those 11 times (1957 being the noteworthy exception), the number was not just negative, but was continuing to decline for a significant period before we tipped into recession. This makes perfect sense, as retail sales generally include many far more discretionary purchases. As the economy accelerates, consumers make more discretionary purchases. As it slows, the more discretionary retail purchases are the first things cut.
So what does that relationship show now? Since you know I'm a smarta$$ and I'm saving a surprise for last, here's the graph up through the most recent data:


Not only is the relationship not negative, not only is it stable for the last few months, but it remains at a level of positivity that has only been exceeded four times in the last 60+ years (once in the 1940s, once in the 1950s, and twice in the early 1970s).

Despite the perfectly rational bearish argument cited above, the facts on the ground are that consumers are not cutting back on discretionary purchases to preserve other spending. Until they do, consumer spending does not support any claim that a recession has begun or is even imminent.

Tuesday, March 8, 2011

An update on savings and growth

- by New Deal democrat

Early last week January savings and spending were reported. I haven't updated those graphs in awhile, so this is a good opportunity to do so.

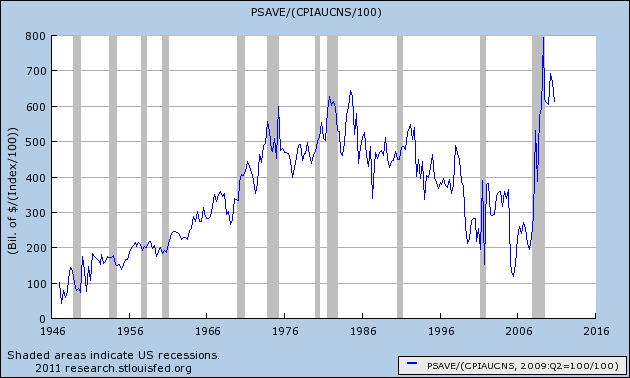
To begin with, on a real, inflation adjusted basis, Americans saved more money at the bottom of the Great Recession than at any time since World War 2:


As you can see, some of that savings has been spent to fuel the recovery so far, but most of the accumulated savings - as much as at the end of the 1980-82 recession - is still available.

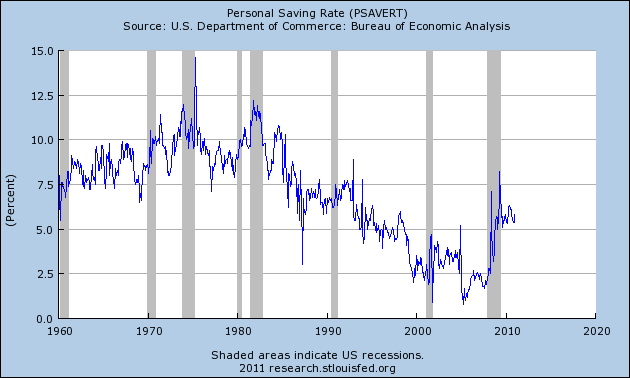
Amercians' relative newfound frugality can be seen in this update graph of the savings rate as well:


This has been trending sideways for over a year and a half, and from the longer term point of view, is a good thing.

Yesterday I pointed out that job growth in 2010 tracked real GDP growth (red) more closely than real retail sales (blue). Which means that the two series have diverged more than usual, as you can see here:


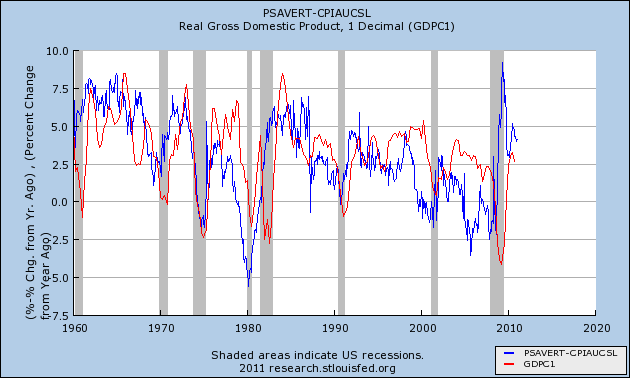
So, how will the divergeance get resolved? Back in August of last year I began keeping track of the real, inflation adjusted personal savings rate, and updated that view in November. Here is how the relationship between the real personal savings rate (blue) and real GDP (red) stands now:


As I said then, the reason for keeping track of the relationship is that as can be seen in the above graph, a substantial change in the real personal savings rate is mirrored by a similar substantial change in real GDP about 6 to 18 months later. Subtract 2% from that change in real GDP, and you have a reliable prediction of the change in jobs growth and the unemployment rate another 6-12 months after that. The logic of this isn't hard to follow: increased savings serve as the "tinder" that ignites subsequent spending. That spending leads to growth, and then that growth leads to the creation of jobs.

Thus an increase in savings is a "long leading indicator" for employment in a range of 18 to 30 months later. We are now about 21 months past that peak increase in savings, so this relationship predicts further increases in YoY job growth in 2011. As I pointed out back in November, "subsequent GDP increases are generally similar to the precursor real personal savings rate -- which has been above 5% for much of the last 18 months. Which means that an unemployment rate significantly under 9% by the end of 2011 is quite doable."

The dramatic drop in the unemployment rate in the last three months bears that out. Put another way, the high "real personal savings rate" argues that the divergence between real GDP and real retail sales will be resolved towards the higher indicator - which also suggests continued robust jobs growth.

Wednesday, February 25, 2009

Will The Consumer Ever Come Back?


Click for a larger image

Above is a chart of the US savings rate. Notice its been declining for the last 20 years or so until it eventually started hovering around 0% and that it has recently spiked up. There are some people who are now arguing the consumer is retrenching completely; meaning, the consumer will no longer be the engine of growth. There are two strong fundamental reasons that support this conclusion.

1.) First, the best reading of job growth during the last expansion is for a total of approximately 8.2 million. In other words, job growth was extremely weak. In addition, we've seen fast rates of job loss over the last year along with real estate and stock market collapses. In other words, the macro environment is such that consumers may be paying a lot of attention to their bottom line and thinking, "I don't need to buy that right now."

2.) Total household debt outstanding has increased from 47% of GDP in 1981 to 96% of GDP in the third quarter of 2008. While there is no bright line in economics that says "above this level the household debt/GDP ratio is bad" I feel fairly certain in saying that when there is almost as much household debt as there is GDP in an economy there are serious problems. The point is the possibility that we are at a saturation level with household debt is pretty high. This leads to the conclusion that the consumer will start to pay his debt down leading to lower consumer spending.

Monday, June 2, 2008

Consumers Are Scrambling for Cash

From the WSJ:

As consumers max out their credit lines and banks clamp down on lending, many older and middle-class Americans are resorting to pricey, often-risky alternatives to stay afloat. Some are depleting their retirement accounts, tapping 401(k)s for both loans and hardship withdrawals. Some new fast-cash options allow homeowners to squeeze equity from their houses -- without the burden of monthly payments. One new product offers a one-time payment. In exchange, the company shares in as much as 50% of any future gain or loss in the property's value, typically collecting proceeds when the house is sold.

Americans are resorting to these more extreme measures due to the combination of dwindling jobs, falling home prices, shaky credit markets and a sharp run-up in food and energy prices. Consumer confidence hit a 28-year low in May, according to the latest Reuters/University of Michigan survey of consumer sentiment. Consumer spending and income inched up 0.2% in April from March, but after adjusting for inflation were flat, government data show.


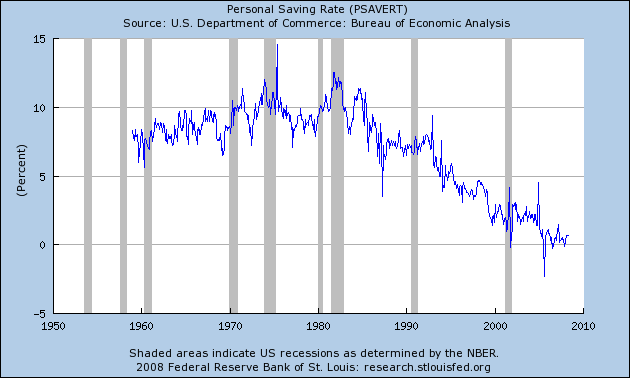
Let's back-up in time a bit. Here is a chart of the personal savings rate from the St. Louis Federal Reserve:


The official savings rate is essentially income less all possible expenses. The logic is people spend and then save. Notice that at the beginning of this expansion, people were already spending practically everything they made. That situation has only become worse.

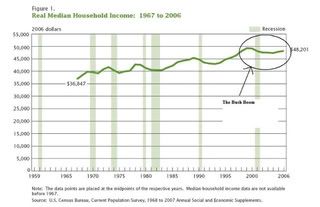
At the same time, real median household income has dropped:


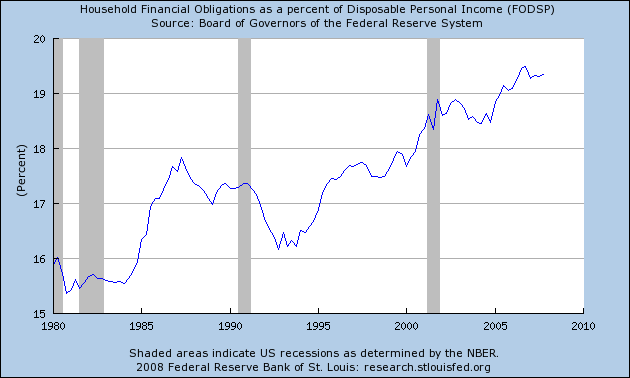
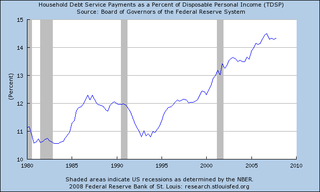
Over the course of this expansion consumers have been stretching their finances in a big way, thereby increasing the household financial obligations ratio.


Put those three conditions together and you already get a consumer that is strapped for cash.

Now we learn that consumers are stretching their already meager savings to maintain their already overstretched lifestyles. Simply put, that is not a good development at all.

Friday, March 14, 2008

Consumer Spending Drops

From the WSJ:

Retail sales decreased by 0.6%, the Commerce Department said Thursday. Sales went up a revised 0.4% in January. Sales that month were originally seen rising 0.3%. Sales in December dropped 0.7%.

Economists surveyed by Dow Jones Newswires estimated a 0.1% increase in February retail sales.

The sales report is a key indicator of U.S. consumer spending. Consumer spending makes up about 70% of gross domestic product, the broad measure of economic activity in the U.S.

High prices for gasoline, the credit crunch, falling home values and drops in other asset prices are seen as factors depressing spending. Another worrisome sign for spending -- and the economy -- is a soft job market. Non-farm payrolls declined by 63,000 jobs in February, the government reported last Friday, an omen that raised chatter about recession.


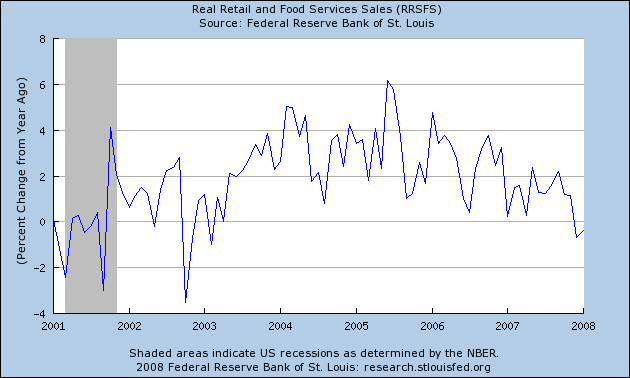
Above is a chart of real (inflation-adjusted) retail sales from the census bureau. Notice the clear downward sloping trend, indicating consumers have been backing away from the market for some time. Also note the year over year change moved into negative territory with yesterday's release.


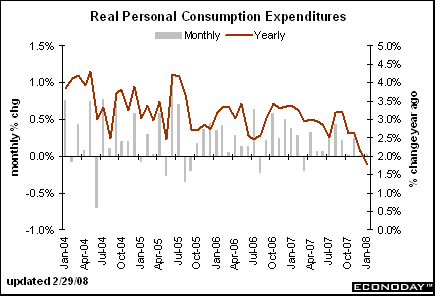
Above is a chart of real personal consumption expenditures from the Bureau of Economic Analysis. This is a broader measure of spending -- it includes things like medical care, housing expenses etc.... This number was in a fairly constant range until roughly the end of last summer. Then it started dropping and has been dropping ever since.

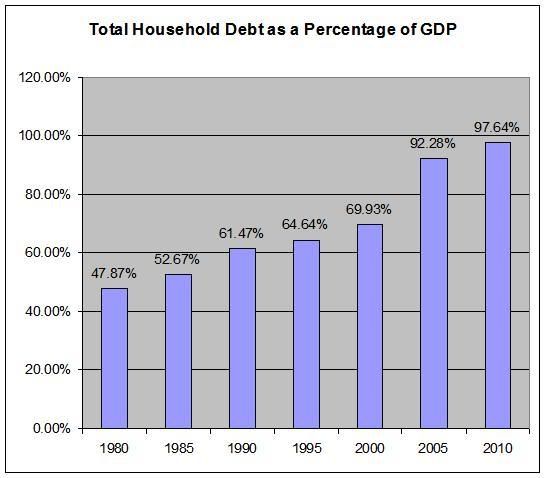
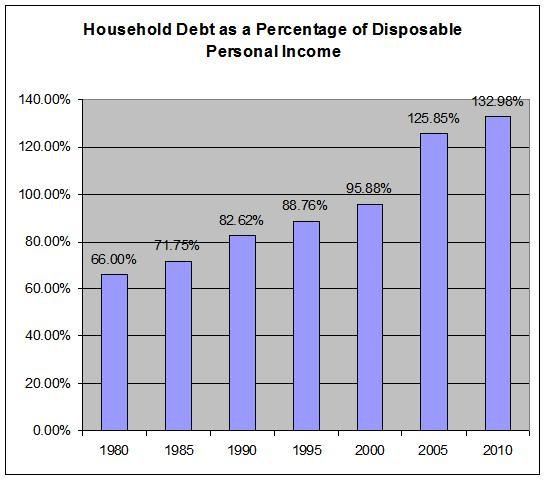
There are two charts that I use a great deal: consumer debt as a percentage of GDP and consumer debt as a percentage of disposable income. And here they are again:


Simply put, there is a ton of debt out there. And it appears it may be getting in the way.

I'm going to add two more charts to the mix. The first is from the blog Calculated Risk.


This is a calculation of the mortgage equity withdrawal using the Kennedy Greenspan method. It shows a clear drop in the amount of home equity consumers are pulling out of their homes. One reason may be the increasing percentage of debt payments as a percentage of disposable income:


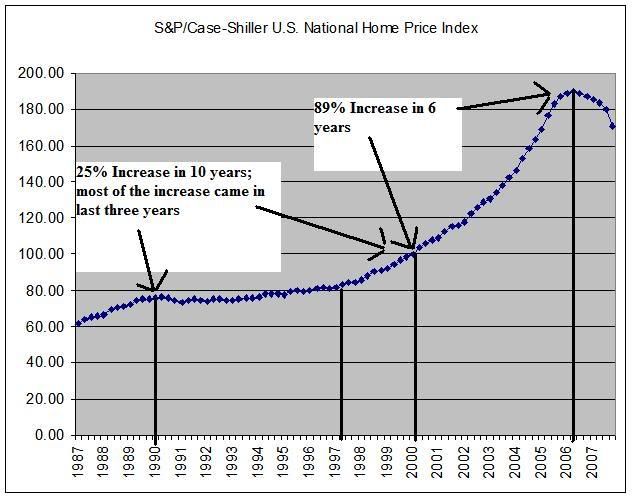
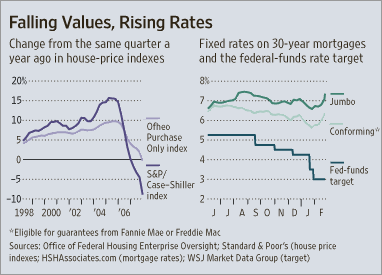
Another reason may be that home prices are dropping:


Regardless of the reason, the bottom line is people are clearly cutting back on thier debt acquisition. And considering incomes have been stagnant for quite some time:


People may simply be saying "I can't afford this" anymore.

Wednesday, August 15, 2007

Consumer Spending, Gas Prices and the Housing Market

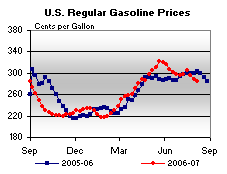
Here is a chart of gas prices from This Week In Petroleum. Notice that gas prices peaked in late May. Since then they have dropped a bit, essentially settling into their standard higher price range of the summer.


Now, when did the sub-prime mess really start to blow-up? Although there were a few problems before the week of July 22, it was that week when Bear Stearns announced it's problems with two hedge funds. So, there was a period of a month 1/2 to month 3/4 when the consumer had some breathing room in terms of negative news.

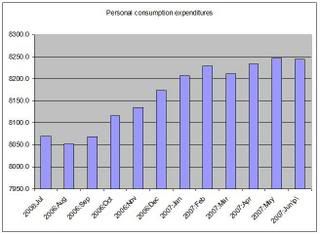
However, notice that June and July Personal Consumption expenditures were still weak on an inflation adjusted basis. In other words, the consumer is still reeling from high gas prices and the turmoil in the markets.


That leads to a question. What is the possibility that consumer spending increases? Probably not that high right now. There are a ton of reasons for the consumer to be fearful.

Saturday, July 7, 2007

More On Consumer Spending

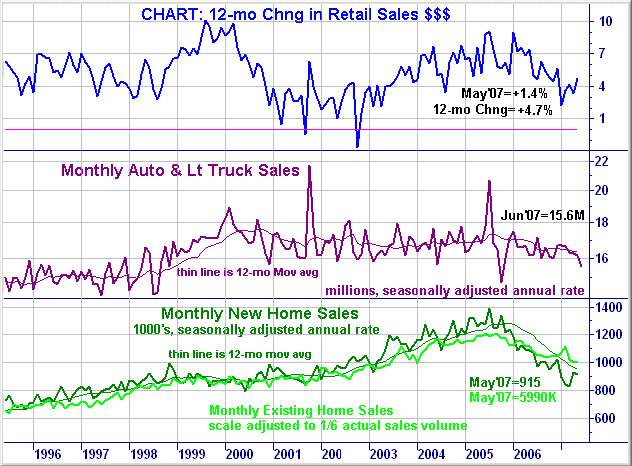
This is a chart from Martin Capital. Notice the following.

1.) The YOY change in retail sales has dropped since the beginning of 2006. However, it has picked-up since the beginning of 2007, possibly representing a reversal of the downward trend.

2.) New and existing home sales have been dropping since mid-2005.

3.) Car sales have consistently fluctuated between roughly 16 million/year and 17.75 million a year since 2001. However, the annual sales pace has consistently declined since the beginning of the year.

Photo Sharing and Video Hosting at Photobucket

Friday, July 6, 2007

How Confident Are Consumers?

From CBS Marketwatch:

Consider this news from Tuesday:

* Sales at retail chain stores continued to weaken in the last week of June. The International Council of Shopping Centers index barely grew week-over-week, while the Redbook index fell to a cyclical low, with same-store sales up just 1.2% compared with a year earlier.

* Vehicle sales declined for the sixth straight month in June. In the past six years, sales have been weaker on only two occasions. At the same time, the automakers have stepped up their production, setting up the industry for another round of layoffs and production cutbacks.

* Home sales fell again in May. The National Association of Realtors said the number of contracts signed on previously owned homes fell 3.5% to the lowest level since the recession.

* More consumers fell behind on their debt payments in the first quarter. The percentage of loans that were 30-days past due rose to the highest level since the recession of 2001.

The news in prior weeks hadn't been much better:

* Home prices fell 2.7% in the past year, the biggest decline in 16 years. A 2.7% drop may not seem like much, but considering how hard it is to get homeowners to accept less than they paid for their house, it's startling.

* Homebuilders got even more depressed about their industry. The housing market index fell to a 16-year low.

* Delinquencies on home mortgages are rising, especially for subprime loans. Unfortunately, delinquencies and foreclosures are also rising for borrowers with good credit who took out adjustable-rate loans. That's unheard of when the unemployment rate is under 5%.

* The stock market, after a nice run up from March to May, has been flat over the past seven weeks.

* Consumer prices rose 0.5% in May, the fastest monthly increase in 17 months.

* Real take-home income (that is, adjusted for inflation) has fallen two months in a row, after a big boost in the first quarter that mostly went to the ultra-rich who received mammoth bonuses and stock options. For the rest of us, the picture is a well-known story around kitchen tables: The median hourly wage, adjusted for inflation, has fallen four months in a row through May and was up just 1.1% in the past year.

* The personal savings rate was negative for the 26th consecutive month in May.


Over the last few years, I've written a fair amount about the heavy indebtedness of the US consumer. The short version is household debt has increased from a little over 70% of total US GDP in 2001 to over 90% in the fourth quarter of 2007. In addition, over the same period of time household debt has increased from over 90% of disposable income to over 130%. Mortgage debt is the primary reason for this increase, as households went on a huge home buying and mortgage equity withdrawal binge over the last few years.

However, I also predicted that the high debt load would lead to a recession or economic slowdown. While the economy did slow in the first quarter of 2007, predictions are for an increase in the second quarter. In other words, my analysis was right by my conclusion was wrong. At least it was wrong.

Is something different now? Has consumer spending reached a point where it will no longer increase, driving economic growth? I don't have an answer for that. However, the initial signs are the consumer is slowing his purchases -- at least for now.

However, history has demonstrated the US consumer loves to shop, and will do almost anything to continue shopping. The US economy has had more than ten straight years of quarterly increases in consumer spending.

For now, I will punt this question but will be thinking about it for quite some time.

Wednesday, May 30, 2007

Inflation Expectations Increasing

From the WSJ:

Higher fuel costs, however, have caused consumers to expect a pickup in inflation in the next 12 months -- to 5.5%, compared with the 4.6% they expected in February.


Standard economy theory states that when people have higher inflation expectations they will spend more now while their dollars are more valuable. If this assumption is true, we could have a partial explanation for why consumer spending has been resilient for about the last year.

I should add, I'm not a bit fan of the psychological side of economic theory, but that's just me arguing economics is trying to explain something way beyond its boundaries.

Wednesday, May 9, 2007

Consumers Are Getting Squeezed From Several Directions

From Bloomberg:

A pickup in U.S. economic growth is becoming more elusive as climbing gasoline prices, falling home values and fewer jobs restrain American consumers, according to economists surveyed by Bloomberg News this month.


And the WSJ is chiming in on this issue as well:

Amid concern about consumers' habits, big retailers issue April sales reports tomorrow, and the Commerce Department follows on Friday with its estimate of retail sales in April. Yesterday, Redbook research said its index of chain-store sales in April fell 4.1% from March. The International Council of Shopping Centers said its measure of chain-store sales last week was running only 1.7% higher than a year ago, the weakest ICSC reading since early March, when the index matched a nearly four-year low.

Bad weather and rising gasoline prices were early explanations, but now there is evidence of a lasting slowdown, said Michael Niemira, chief economist at ICSC. "Over the last two weeks there's been a little more unease that some of this weakness is broader based. The worry level is higher."


Right now consumer spending is the only economic sector keeping the economy from dipping into a recession. That means consumers have to keep spending. But they are coming under increasing pressure to slow down from several areas.

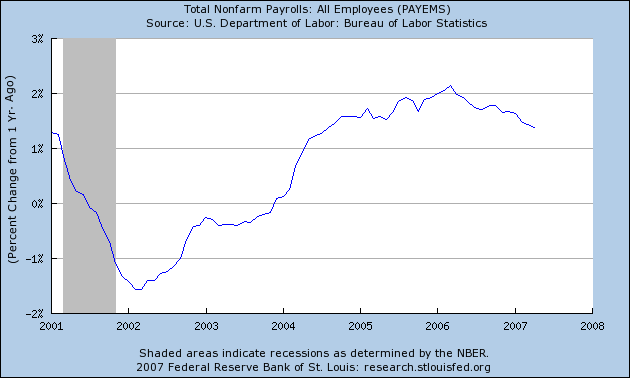
1.) Employment Growth is Slowing Down. Notice the chart of the year-over-year change in employment is trending lower.

Photo Sharing and Video Hosting at Photobucket

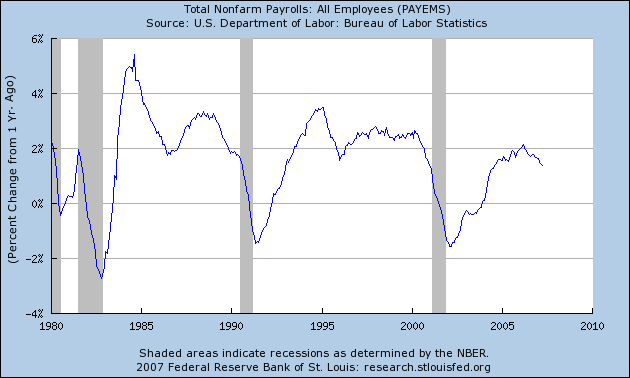
Also note this is occurring against a backdrop of weaker employment growth compared to other expansions. Here is the same chart going back to 1980:

Photo Sharing and Video Hosting at Photobucket

2.) Wage growth is fair, but not great. According to the Bureau of Labor Statistics the average hourly earnings of production workers were $16.55 in April 2006 and $17.21 in April 2007 for an increase of 3.98%. Over the same period the inflation level increased from 199.8 to 205.352 for an an increase of 2.77, making the yearly gain 1.21%. Going back over the same period but in an earlier year (2005 and 2004) we get a 2-year and 3-year gain of 1.46% and .96%. In other words, incomes are increasing, but they are doing so just a tad faster than inflation.

3.) Gas prices hit a record over the last few weeks. This is a price that consumers see on a regular basis, making it more prone to impact consumer spending patterns.

4.) Home prices are expected to decline this year.

U.S. home price declines this year are going to be steeper than earlier forecast because of the drop in subprime mortgage lending and the adoption of stricter loan standards, the National Association of Realtors said.

The 2007 median price for an existing home likely will drop 1 percent to $219,800 from 2006, compared with its earlier forecast of a 0.7 percent decline, the Chicago-based association said in a report today. It now projects the median price for new homes to fall $100 to $246,400, the first decline since 1991, from its previous estimate of a 0.4 percent increase.


That means the cash-out refi is going away -- or at least slowing down. As

-- wages aren't rising fast enough to keep up with big increases in consumer spending,

-- the "home as ATM" is going away, and

-- consumers are already dipping into savings to finance purchases,

you have to wonder where the money for continued increases in consumer spending is going to come from.